RY 144.17 0.4529% TD 77.39 0.0517% SHOP 78.87 -1.3878% CNR 171.64 0.5625% ENB 50.09 -0.4769% CP 110.62 0.6277% BMO 128.85 -0.548% TRI 233.58 1.1563% CNQ 103.29 -0.174% BN 60.87 -0.2295% ATD 75.6 -1.447% CSU 3697.0 1.1582% BNS 65.76 -0.3485% CM 66.6 -0.5525% SU 54.21 1.1569% TRP 53.15 0.3398% NGT 58.54 -0.3405% WCN 226.5 0.4123% MFC 35.905 0.9986% BCE 46.75 -0.5954%
Section 1: Introduction
Section 2: Company Overview
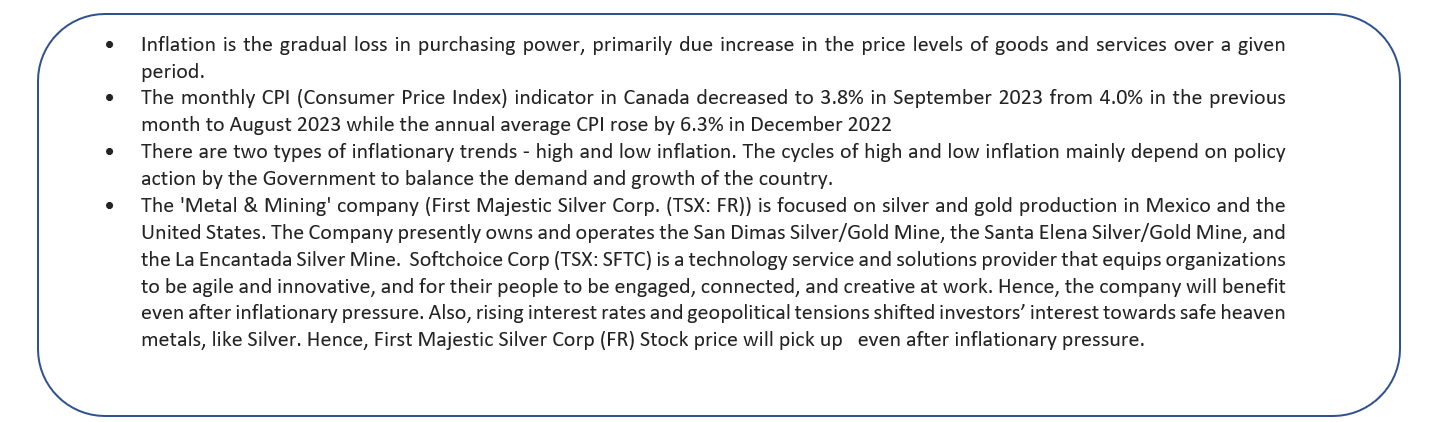
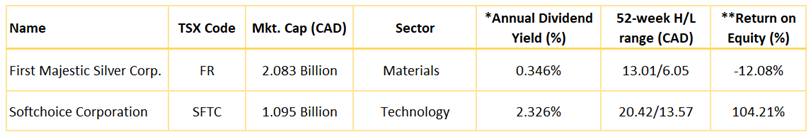
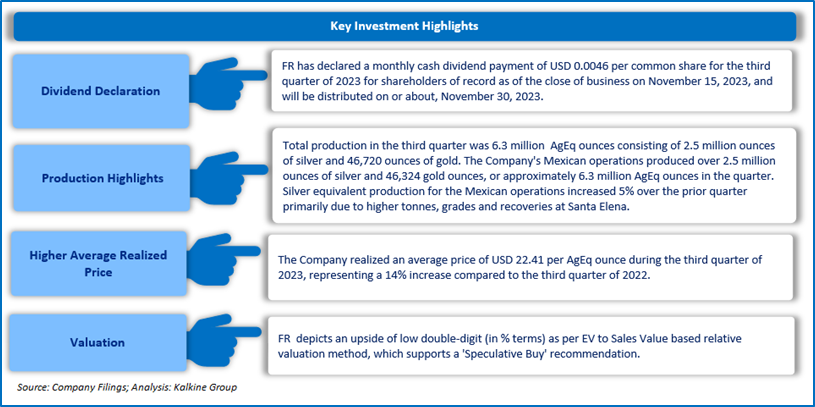
First Majestic Silver Corp (TSX: FR) is a publicly traded mining company focused on silver and gold production in Mexico and the United States. The Company presently owns and operates the San Dimas Silver/Gold Mine, the Santa Elena Silver/Gold Mine and the La Encantada Silver Mine.
Kalkine’s Inflation Report covers the Investment Highlights, Key Financial Metrics, Risks, Technical Analysis along with the Valuation, Target Price, and Recommendation on the stock.
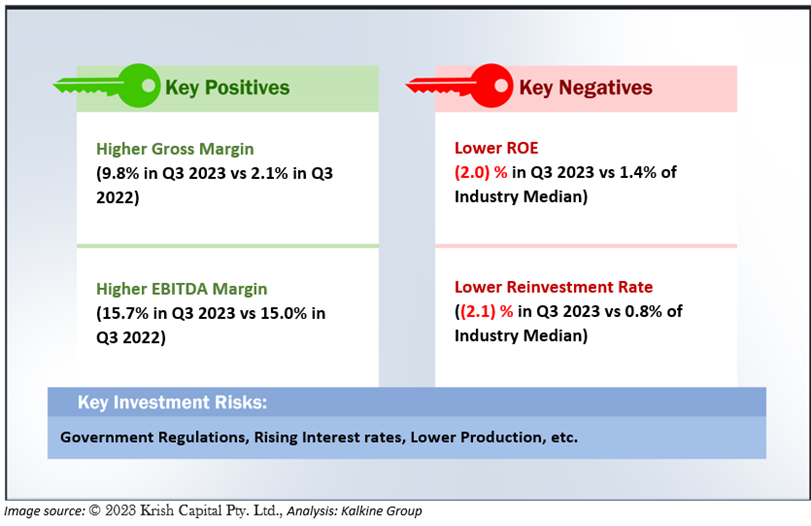
2.1 The Key Positives, Negatives, Investment Highlights, and Risks
Section3: Financial Highlights
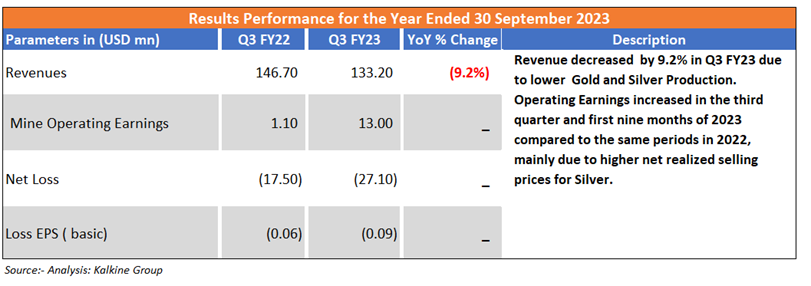
3.1 Key Financial Highlights
Section 4: Key Metrics
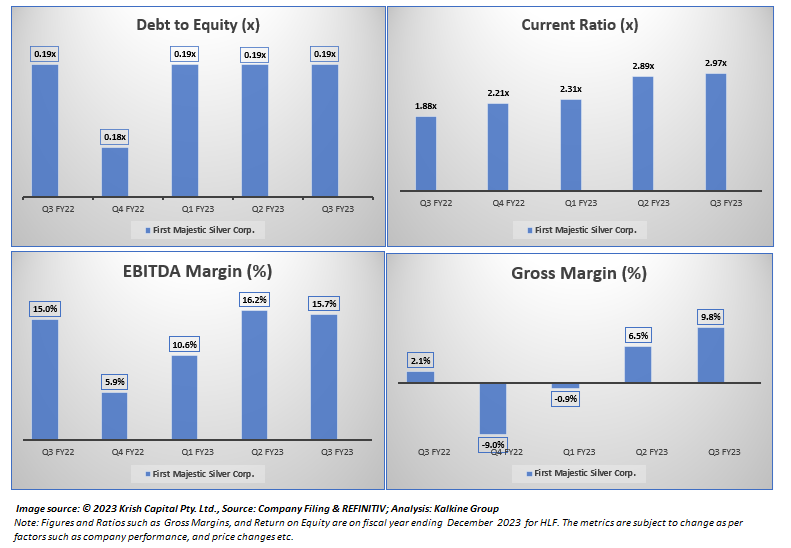
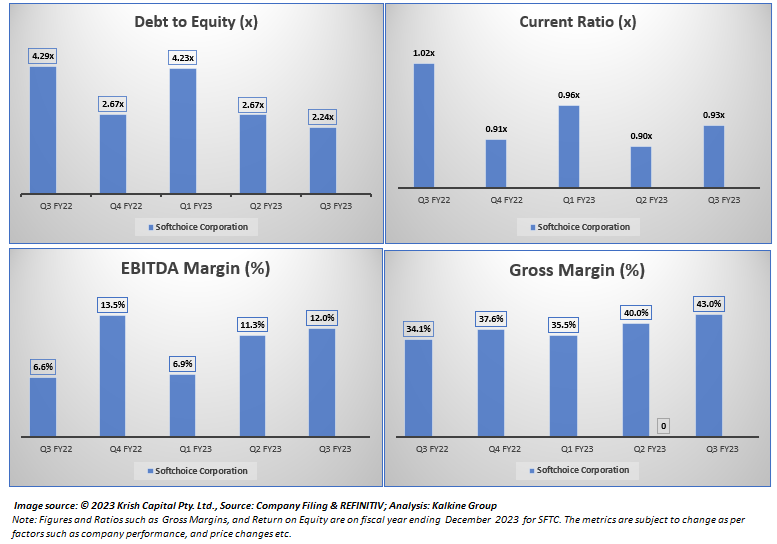
The company has successfully improved its Gross Margin in the current quarter. Also, the company is maintaining healthy liquidity ratios, i.e., Current Ratio improved in the current quarter. Below charts depict the change in EBITDA Margins, Gross Margins and Current Ratio for the firm in the one past year.
Section 5: Stock Recommendation Summary
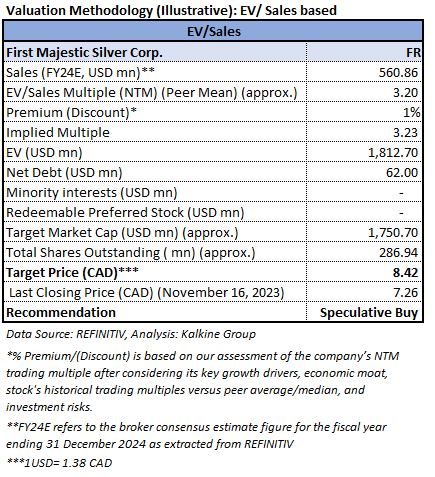
5.1 Valuation Methodology Illustrative EV to Sales Based
5.2 Price Performance and Stock Recommendation

The stock has witnessed a downside of ~6.32% in 1 month and a downside of ~8.21% over the last 3 months. Moreover, the stock is trading below the above of 52-week high price of CAD 13.01 and 52-week low price of CAD 6.05 providing an opportunity to ride the trend. First Majestic Silver Corp. (TSX: FR) was last covered on 27th October 2023.
5.3 One-Year Technical Price Chart

One-Year Technical Price Chart (as of November 16, 2023). Source: REFINITIV, Analysis: Kalkine Group
5.4 Technical Summary
Note 1: Past performance is not a reliable indicator of future performance.
Note 2: The reference date for all price data, currency, technical indicators, support, and resistance levels is November 16, 2023. The reference data in this report has been partly sourced from REFINITIV.
Note 3: Investment decisions should be made depending on an individual's appetite for upside potential, risks, holding duration, and any previous holdings. An 'Exit' from the stock can be considered if the Target Price mentioned as per the Valuation and or the technical levels provided has been achieved and is subject to the factors discussed above.
Technical Indicators Defined: -
Support: A level at which the stock prices tend to find support if they are falling, and a downtrend may take a pause backed by demand or buying interest.
Resistance: A level at which the stock prices tend to find resistance when they are rising, and the uptrend may take a pause due to profit booking or selling interest.
Stop-loss: In general, it is a level to protect further losses in case of any unfavourable movement in the stock prices.
Softchoice Corporation
Section 1: Company Overview
Softchoice Corp (TSX: SFTC) is a technology service and solutions provider that equips organizations to be agile and innovative, and for their people to be engaged, connected, and creative at work. That means moving them to the cloud, helping them build the workplace of tomorrow, and enabling them to make smarter decisions about their technology portfolio. Kalkine’s Inflation Report covers the Investment Highlights, Key Financial Metrics, Risks, Technical Analysis along with the Valuation, Target Price, and Recommendation on the stock.
1.1 The Key Positives, Negatives, Investment Highlights, and Risks

Section2: Financial Highlights
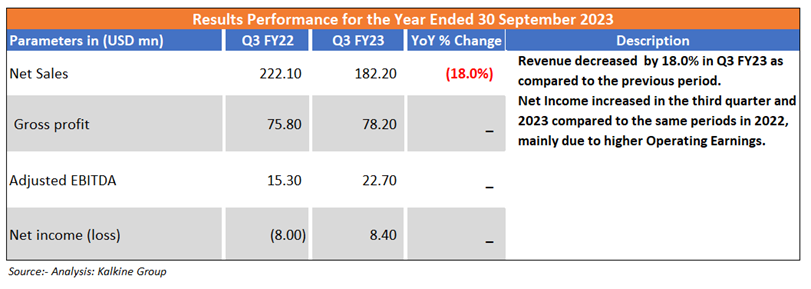
2.1 Key Financial Highlights
Section 3: Key Metrics
Below charts depict the change in Debt to Equity, Current Ratio and Gross margins ratios of the Company for the last one year.
Section 4: Stock Recommendation Summary
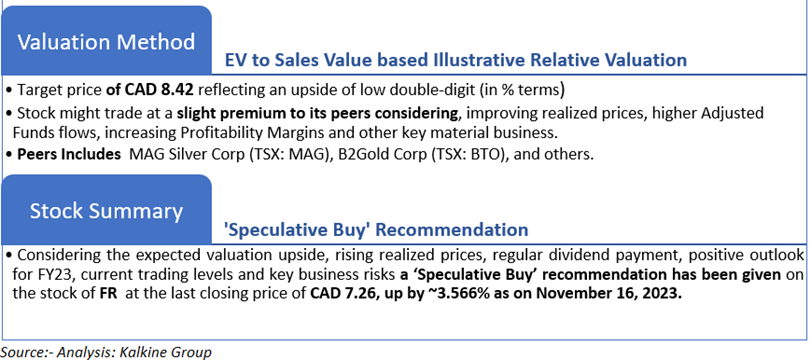
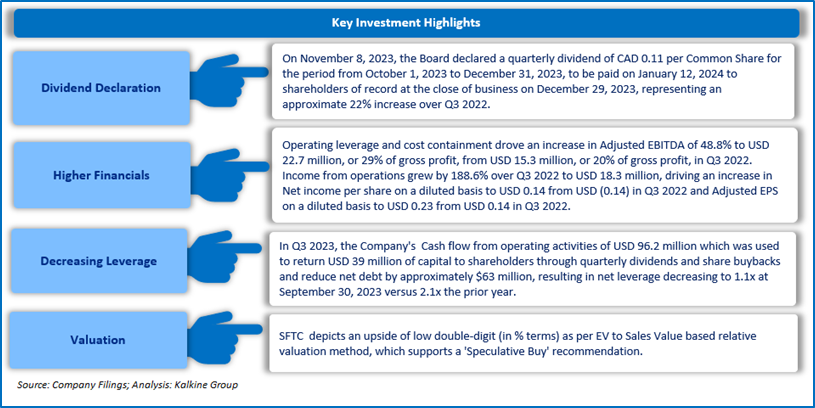
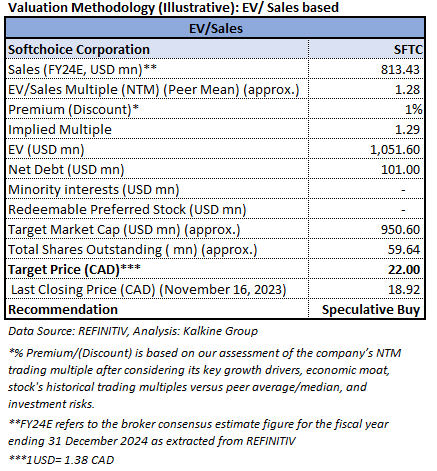
4.1 Valuation Methodology Illustrative EV to Sales Based
4.2 Price Performance and Stock Recommendation

The stock has witnessed an upside of ~19.14% in 1 month and of ~23.66% over the last 3 months. Moreover, the stock is trading above the average of 52-week high price of CAD 20.42 and 52-week low price of CAD 13.57 providing an opportunity to ride the trend.

4.3 One-Year Technical Price Chart

One-Year Technical Price Chart (as of November 16, 2023). Source: REFINITIV, Analysis: Kalkine Group
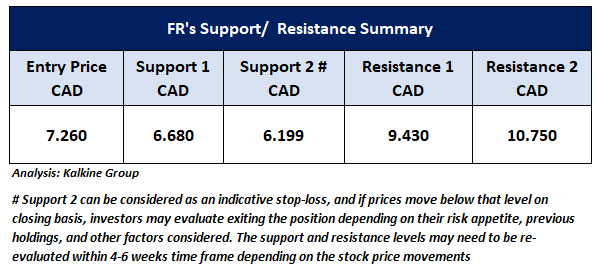
4.4 Technical Summary

Note 1: Past performance is not a reliable indicator of future performance.
Note 2: The reference date for all price data, currency, technical indicators, support, and resistance levels is November 16, 2023. The reference data in this report has been partly sourced from REFINITIV.
Note 3: Investment decisions should be made depending on an individual's appetite for upside potential, risks, holding duration, and any previous holdings. An 'Exit' from the stock can be considered if the Target Price mentioned as per the Valuation and or the technical levels provided has been achieved and is subject to the factors discussed above.
Technical Indicators Defined: -
Support: A level at which the stock prices tend to find support if they are falling, and a downtrend may take a pause backed by demand or buying interest.
Resistance: A level at which the stock prices tend to find resistance when they are rising, and the uptrend may take a pause due to profit booking or selling interest.
Stop-loss: In general, it is a level to protect further losses in case of any unfavourable movement in the stock prices.
The advice given by Kalkine Canada Advisory Services Inc. and provided on this website is general information only and it does not take into account your investment objectives, financial situation and the particular needs of any particular person. You should therefore consider whether the advice is appropriate to your investment objectives, financial situation and needs before acting upon it. You should seek advice from a financial adviser, stockbroker or other professional (including taxation and legal advice) as necessary before acting on any advice. Not all investments are appropriate for all people. The website www.kalkine.ca is published by Kalkine Canada Advisory Services Inc. The link to our Terms & Conditions has been provided please go through them. On the date of publishing this report (mentioned on the website), employees and/or associates of Kalkine do not hold positions in any of the stocks covered on the website. These stocks can change any time and readers of the reports should not consider these stocks as advice or recommendations later.
 CA
CA  AU
AU UK
UK US
US NZ
NZ Please wait processing your request...