RY 144.17 0.4529% TD 77.39 0.0517% SHOP 78.87 -1.3878% CNR 171.64 0.5625% ENB 50.09 -0.4769% CP 110.62 0.6277% BMO 128.85 -0.548% TRI 233.58 1.1563% CNQ 103.29 -0.174% BN 60.87 -0.2295% ATD 75.6 -1.447% CSU 3697.0 1.1582% BNS 65.76 -0.3485% CM 66.6 -0.5525% SU 54.21 1.1569% TRP 53.15 0.3398% NGT 58.54 -0.3405% WCN 226.5 0.4123% MFC 35.905 0.9986% BCE 46.75 -0.5954%
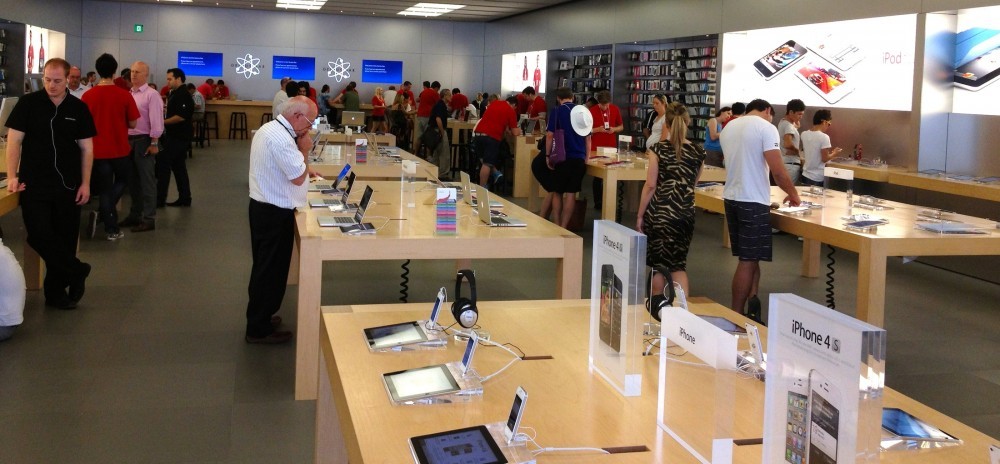
Company overview - Apple Inc. designs, manufactures and markets mobile communication and media devices, personal computers and portable digital music players. The Company sells a range of related software, services, accessories, networking solutions, and third-party digital content and applications. The Company's segments include the Americas, Europe, Greater China, Japan and Rest of Asia Pacific. The Americas segment includes both North and South America. The Europe segment includes European countries, India, the Middle East and Africa. The Greater China segment includes China, Hong Kong and Taiwan. The Rest of Asia Pacific segment includes Australia and the Asian countries not included in the Company's other operating segments. Its products and services include iPhone, iPad, Mac, iPod, Apple Watch, Apple TV, a portfolio of consumer and professional software applications, iPhone OS (iOS), OS X and watchOS operating systems, iCloud, Apple Pay and a range of accessory, service and support offerings.

AAPL Details
Q2FY17 driven by growth in revenue from services segment: For Q2FY17, Apple Inc (NASDAQ: AAPL) reported 5% yoy growth in net sales at $52.9 billion, primarily driven by robust growth in Services, Mac and Other Products, partially offset by the effect of weakness in foreign currencies relative to the U.S. dollar. Net sales reflected year-over-year growth in each of the geographic operating segments, except for Greater China. Gross margin decreased during the second quarter and first six months of 2017 compared to the same periods in 2016 due to higher product cost structures and the effect of weakness in foreign currencies relative to the U.S. dollar, partially offset by a favorable mix of products and services. The Company anticipates gross margin during the third quarter of 2017 to be between 37.5% and 38.5%. During the second quarter of 2017, the Company introduced a new 9.7-inch iPad, which became available at the end of the quarter. Further, the Company utilized $7.0 billion to repurchase shares of its common stock and paid dividends and dividend equivalents of $3.0 billion, while issued $11.0 billion of U.S. dollar-denominated long-term debt during the second quarter of 2017.
.jpg)
Sales performance in Millions; (Source: Company reports)
Revenue from iPads impacted by lower unit sales: iPhone net sales increased during the second quarter of 2017 compared to the same period in 2016 due to higher average selling prices (ASP), while the year-over-year increase in net sales during the first six months of 2017 was primarily led by higher unit sales and to a lesser extent higher iPhone ASPs, partially offset by the effect of weakness in foreign currencies relative to the U.S. dollar. However, iPad net sales decreased in the second quarter and first six months of 2017 compared to the same periods in 2016 due to lower iPad unit sales in each of the geographic operating segments. Mac net sales increased during the second quarter and first six months of 2017 compared to the same periods in 2016, led by different mix of Macs, including the new MacBook Pro introduced in the first quarter of 2017, and to a lesser extent higher Mac unit sales. The increase in Services net sales in the second quarter and first six months of 2017 compared to the same periods in 2016 was primarily led by growth from the App Store and licensing sales. Further, year-over-year increase in Services net sales during the first six months of 2017 was partially offset by the non-recurrence of the $548 million received from Samsung Electronics Co., Ltd. in the first quarter of 2016 related to patent infringement matters.
.png)
Sales performance by product in Millions; (Source: Company reports)
Increase in operating expenses led by increasing sales force: AAPL continues to develop innovative technologies to enhance existing products and to expand the range of its product offerings through R&D, licensing of intellectual property and acquisition of third-party businesses and technology. The growth in R&D expense during the second quarter and first six months of 2017 was driven by an increase in headcount and related expenses to support expanded R&D activities. Further, the year-over-year growth in selling, general and administrative expense during the first six months of 2017 was driven by an increase in headcount and related expenses and higher variable selling costs. The increase in other income/(expense), net during the second quarter and first six months of 2017 was primarily due to higher interest income and the favorable impact of foreign exchange-related items, partially offset by higher interest expense on debt. The weighted-average interest rate earned by the Company on its cash, cash equivalents and marketable securities stood at 1.99% and 1.74% in the second quarter of 2017 and 2016, respectively, and 1.93% and 1.70% in the first six months of 2017 and 2016, respectively.
.png)
Operating expenses in Millions; (Source: Company reports)
Continues to expand its platform for the discovery and delivery of digital content: AAPL is aimed at bringing the best user experience to its customers through its innovative hardware, software and services. The Company leverages its unique ability to design and develop its own operating systems, hardware, application software and services to provide its customers products and solutions with innovative design, superior ease-of-use and seamless integration. As part of its strategy, the Company continues to expand its platform for the discovery and delivery of digital content and applications through its Digital Content and Services, which allows customers to discover and download digital content through iPhone, iPad and iPod touch devices, Apple TV and Apple Watch. Further, it also supports a community for the development of third-party software and hardware products and digital content that complement the Company’s offerings. Moreover, it is building and expanding its own retail and online stores and its third-party distribution network to effectively reach more customers and provide them with a high-quality sales and post-sales support experience.
Source: Google images
Quarterly cash flows: During the six months ended April 1, 2017, cash generated by operating activities stood at $39.6 billion, as a result of $28.9 billion of net income, non-cash adjustments to net income of $10.4 billion and an increase in the net change in operating assets and liabilities of $0.3 billion. Cash flows from investing activities was at $33.3 billion, primarily of cash used for purchases of marketable securities, net of sales and maturities, of $26.9 billion and cash used to acquire property, plant and equipment of $6.3 billion. Cash flows from financing activities stood at $11.6 billion, primarily used to repurchase common stock of $18.0 billion and pay dividends and dividend equivalents of $6.1 billion, partially offset by proceeds from the issuance of term debt, net of $11.0 billion and a net increase in commercial paper of $1.9 billion.
.png)
Cash flows and liquidity position in Millions; (Source: Company reports)
Expanding the total capital return program by increasing dividends: On May 2, 2017, the Company announced that increased the total capital return program from $250 billion to $300 billion, which includes an increase in the share repurchase authorization from $175 billion to $210 billion. Additionally, the Company announced that the Board of Directors raised the Company's quarterly cash dividend by 10.5% from $0.57 to $0.63 per share, beginning with the dividend to be paid during the third quarter of 2017. Further, it expects to execute its capital return program by the end of March 2019 by paying dividends and dividend equivalents, repurchasing shares and remitting withheld taxes related to net share settlement of restricted stock units. The Company plans to continue to access the domestic and international debt markets to assist in funding its capital return program.
.png)
Return of capital and cash position; (Source: Company reports)
FY16 impacted by decline in iPhone sales and forex fluctuations: For FY16, the company reported 8% yoy decline in net sales at $18.1 billion, primarily driven by a year-over-year decrease in iPhone net sales and the effect of weakness in most foreign currencies relative to the U.S. dollar, partially offset by an increase in Services. During 2016, the Company spent $29.0 billion to repurchase shares of its common stock and paid dividends and dividend equivalents of $12.2 billion. Additionally, the Company issued $23.9 billion of U.S. dollar-denominated term debt and A$1.4 billion of Australian dollar-denominated term debt during the same period.
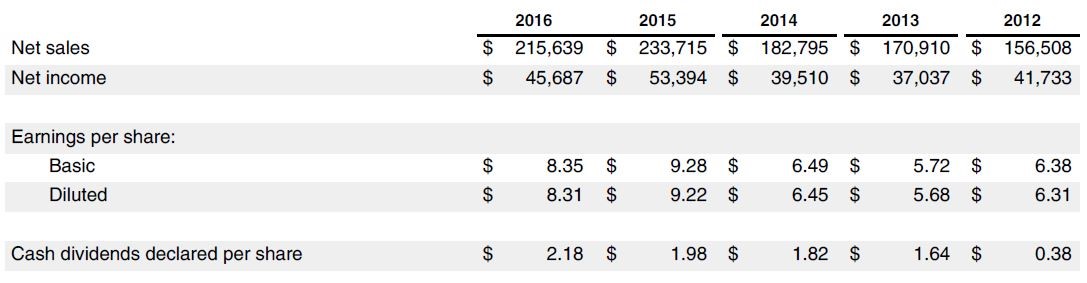
Annual Financial data in Millions, except per share data; (Source: Company reports)
Stock Performance: The shares of AAPL has risen 24.6% in last six months while it was up 53% in the last one year. Notably, over the past ten years AAPL has generated 747.6% return to shareholders driven by constant innovative technologies and new product offerings with dominant position in the industry. Importantly, ongoing investment in research and development (R&D), marketing and advertising is critical to the development as the industry is characterized by rapid technological advances and the Company’s ability to compete successfully depends heavily upon its ability to ensure a continual and timely flow of competitive products, services and technologies to the marketplace. The Company continues to develop modern technologies to enhance existing products and to expand the range of its product offerings through R&D, licensing of intellectual property and acquisition of third-party businesses and technology. Total R&D expenses stood at $10.0 billion, $8.1 billion and $6.0 billion in 2016, 2015 and 2014 respectively. Further, given the on-going investments in new products and expansion of its stores in emerging economies, we believe that the Apple is well placed in the industry from long term perspective and give a “Buy” recommendation on the stock at the current market price of $145.87

APPL Daily chart; (Source: Thomson Reuters)
Disclaimer
The advice given by Kalkine Pty Ltd and provided on this website is general information only and it does not take into account your investment objectives, financial situation or needs. You should therefore consider whether the advice is appropriate to your investment objectives, financial situation and needs before acting upon it. You should seek advice from a financial adviser, stockbroker or other professional (including taxation and legal advice) as necessary before acting on any advice. Not all investments are appropriate for all people. Kalkine.com.au and associated websites are published by Kalkine Pty Ltd ABN 34 154 808 312 (Australian Financial Services License Number 425376). The information on this website has been prepared from a wide variety of sources, which Kalkine Pty Ltd, to the best of its knowledge and belief, considers accurate. You should make your own enquiries about any investments and we strongly suggest you seek advice before acting upon any recommendation. Kalkine Pty Ltd has made every effort to ensure the reliability of information contained in its newsletters and websites. All information represents our views at the date of publication and may change without notice. To the extent permitted by law, Kalkine Pty Ltd excludes all liability for any loss or damage arising from the use of this website and any information published (including any indirect or consequential loss, any data loss or data corruption). If the law prohibits this exclusion, Kalkine Pty Ltd hereby limits its liability, to the extent permitted by law to the resupply of services. There may be a product disclosure statement or other offer document for the securities and financial products we write about in Kalkine Reports. You should obtain a copy of the product disclosure statement or offer document before making any decision about whether to acquire the security or product. The link to our Terms & Conditions has been provided please go through them and also have a read of the Financial Services Guide. On the date of publishing this report (mentioned on the website), employees and/or associates of Kalkine Pty Ltd do not hold positions in any of the stocks covered on the website. These stocks can change any time and readers of the reports should not consider these stocks as advice or recommendations.
 CA
CA  AU
AU UK
UK US
US NZ
NZ Please wait processing your request...