RY 144.17 0.4529% TD 77.39 0.0517% SHOP 78.87 -1.3878% CNR 171.64 0.5625% ENB 50.09 -0.4769% CP 110.62 0.6277% BMO 128.85 -0.548% TRI 233.58 1.1563% CNQ 103.29 -0.174% BN 60.87 -0.2295% ATD 75.6 -1.447% CSU 3697.0 1.1582% BNS 65.76 -0.3485% CM 66.6 -0.5525% SU 54.21 1.1569% TRP 53.15 0.3398% NGT 58.54 -0.3405% WCN 226.5 0.4123% MFC 35.905 0.9986% BCE 46.75 -0.5954%

Company Overview: Bank of America Corporation is a bank holding company and a financial holding company. The Company is a financial institution, serving individual consumers and others with a range of banking, investing, asset management and other financial and risk management products and services. The Company, through its banking and various non-bank subsidiaries, throughout the United States and in international markets, provides a range of banking and non-bank financial services and products through four business segments: Consumer Banking, which comprises Deposits and Consumer Lending; Global Wealth & Investment Management, which consists of two primary businesses: Merrill Lynch Global Wealth Management and U.S. Trust, Bank of America Private Wealth Management; Global Banking, which provides a range of lending-related products and services; Global Markets, which offers sales and trading services, and All Other, which consists of equity investments, residual expense allocations and other.
.png)
BAC Details
Bank of America Corp (NYSE: BAC), is a bank holding company that caters to individual consumers, small and middle market businesses, institutional investors, corporations etc. across the United States and international markets. The bank’s latest result adds to its continuous performance with improved efficiency. Further, expansion efforts are moving in the right direction and are expected to boost the stock performance with better financial capabilities demonstrated by the group. The bank is also working on enhanced digitization with reduced manual processes across Global Banking and Markets and is engaging various AI, Robotics and Automation, based systems to emerge as a tech-savvy bank. Coming to fundamentals, the group’s pre-tax ROE is also as per industry median.
Beaten the Analysts’ Estimates for the third quarter 2018: BAC has posted better-than-expected results for the third quarter of 2018; and reported for adjusted earnings per share of 66 cents, up 43% and beating the analysts’ estimates for the adjusted earnings per share of 62 cents. The bank had reported the adjusted revenue growth of 4 percent to $22.8 billion in the third quarter of FY 18, beating the analysts’ estimates for revenue of $22.67 billion. The Provision for credit losses declined by $118 million to $716 million in the third quarter, after rising by $101 million in the second quarter. The market had expected an increase of $137 million. However, net interest income has risen 6 percent to $11.9 billion during the quarter. Net interest margin was up 0.04 percent to 2.42 percent, which is slightly ahead of consensus estimates of 2.41 percent. There was a 32% growth in net income to $7.2 billion in the third quarter, driven by healthy operating leverage along with asset quality. The bank also benefitted from tax reform scenario. Further, during the third quarter, non-interest expenses declined by 2 percent, and the bank’s efficiency ratio expanded to 57 percent. BAC also reported a record third-quarter pretax income of $9 billion, up 18% and $929.8 billion in total loans. The strength in credit quality was seen in consumer and commercial portfolios, while net charge-offs increased by $32 million to $932 million owing to the credit card portfolio seasoning and loan growth (net charge-off ratio was at 0.40%). Better performance in consumer real estate and energy portfolios helped net reserve release to be of the order of $216 million. BAC’s nonperforming assets have fallen by $1.4 billion to $5.4 billion, on the back of improvements in both consumer and commercial portfolios. Overall, BAC during the third quarter performed well due to strong U.S. economy and a healthy U.S. consumer base that combined to deliver the highest quarterly pre-tax earnings in the bank’s history.
.png)
Third Quarter 2018 Performance (Source: Company Reports)
Strong Asset Quality: During the third quarter 2018, BAC reduced the total net charge-offs from 2Q18 and the net charge off ratio has fallen 3bps to 0.40%. Consumer net charge-offs declined $54MM, which reflects the seasonally lower losses in credit card and its net charge-off ratio was down 5 bps to 0.69%. Commercial net charge-offs declined by $10MM and its net charge-off ratio is down 1 bp to 0.13% (0.08% excl. small business). Further, the provision expense has fallen by $111MM from 2Q18. The net reserve release of $216MM in 3Q18, reflects the improvements in consumer real estate and energy. Moreover, in the third quarter, the nonperforming loans (NPLs) were down $743MM from 2Q18, on the back of improvements in both consumer and commercial segments. BAC has reduced commercial reservable criticized utilized exposure of $760MM from 2Q18, which reflects broad-based improvements.
Strong Performance of Consumer Banking in the third quarter: During the third quarter 2018, for Consumer Banking segment, the net income rose by 49% to $3.1B from 3Q17. Revenue of the segment grew 7% to $9.4B in Q3 2018. The segment witnessed strong NII growth, on the back of higher interest rates and growth in deposits and loans. The noninterest income fell slightly, as higher card income and service charges were more than offset by lower mortgage banking income. The provision has fallen $0.1B from 3Q17, primarily due to a smaller reserve build in credit card. The net charge-offs rose by $0.1B to $0.9B due to credit card portfolio seasoning and loan growth. The segment’s noninterest expense declined 2%, from 3Q17, due to investments for business growth that were more than offset by improved productivity. The Efficiency ratio of the segment improved 455 bps to 46% in Q3 2018. There is continued investment in financial center builds/renovations and digital capabilities. The average deposits grew 4% to $688B. Average loans and leases rose 6% to $285B from 3Q17, driven by growth in residential mortgage and credit card. The client brokerage assets grew 22% to $204B from 3Q17, due to strong client flows and market performance. The combined card spend grew 7% from 3Q17. The active mobile banking users were up 10% to 25.9MM and mobile channel usage were up 17% from 3Q17.
Positive Performance of Global Wealth & Investment Management in the third quarter: During the third quarter 2018, for Global Wealth & Investment Management, the net income grew 31% to $1.0B from 3Q17. The segment’s revenue grew 4% to $4.8B from 3Q17 due to 9% higher asset management fees and net interest income were partially offset by lower transactional revenue. Noninterest expense of the segment rose 1% from 3Q17, due to higher revenue-related incentives and investment in sales professionals were largely offset by continued expense discipline. The client balances grew to a record $2.8T, up 6% from 3Q17, due to higher market valuations and solid assets under management (AUM) flows. Moreover, average deposits declined 1% to $238B from 3Q17 and the average loans and leases rose 5% to $162B driven by residential mortgage and custom lending.
Decent Growth of Global Banking in the third quarter: During the third quarter 2018, for Global Banking, the net income grew 13% to $2.0B. However, the revenue fell 5% to $4.7B, which reflects lower investment banking fees and the impact of tax reform on certain tax-advantaged investments, partially offset by higher NII from the benefit of higher interest rates and growth in deposits. Further, total Corporation investment banking fees fell 18% to $1.2B (excl. self-led) driven primarily by advisory and leveraged finance, partially offset by an increase in equity underwriting fees. The provision rose $0.1B from 3Q17, due to continued improvements in energy and broader asset quality.
Decent Growth of Global Market in the third quarter: For Global Markets, net income grew 21% to $0.9B from 3Q17 but the revenue declined 1% from 3Q17. However, excluding net DVA, the revenue rose 1%, which reflects lower sales and trading revenue; and investment banking fees, mostly offset by a gain on sale of an equity investment (excluded from sales and trading revenue).
.png)
Operating Leverage (Source: Company Reports)
Aggressively Expanding Footprint: BAC has opened 103 financial centers over the last 3 years and around 53 over past one year. The bank has announced plans to open more than 500 new financial centers over next 4 years. BAC has plans to expand into new cities with existing wealth management or having the commercial presence. The cities planned for expansion comprise of Denver, Minneapolis / St. Paul, Indianapolis, Pittsburgh, Cincinnati, Cleveland, Columbus, Salt Lake City, Lexington. Moreover, BAC has redesigned about 700 financial centers with new technology or layouts over past 3 years; and 1,200 more redesigns have been planned by the bank. This includes the opening of 600 Merrill Edge investment centers by 2020, opening 100 student centers by end of 2018 and 100% of ATMs cardless-enabled. The bank has already replaced 75% of ATM network since 2015 and plans to complete all replacements by mid-2019.
Capital Management: BAC has repurchased $14.9 billion in common stock and paid $4.0 billion in common dividends YTD. Meanwhile, BAC has declared a regular quarterly cash dividend on BAC common stock of $0.15 per share, which will be payable on December 28 to shareholders of record as of December 7. BAC’s board has also declared a regular quarterly cash dividend of $1.75 per share on the 7 percent Cumulative Redeemable Preferred Stock, Series B. This dividend will be payable on January 25, 2019 to shareholders of record as of January 11, 2019.
Stock Recommendation: BAC stock is trading at $28.43, and has support at $26.2 and resistance at $29.5. During the third quarter 2018, the diluted earnings per share rose 43% and posted record earnings. The pretax earnings were up 18% from the corresponding quarter of 2017. BAC’s asset quality remained strong during the quarter and has increased capital returns to shareholders. BAC continues to expand into new markets, and has recently opened the first financial center in Pittsburgh, and it plans to open centers in Salt Lake City in the coming months. BAC will benefit from higher interest rates and an improving economic environment going forward. With an expectation of high single digit to low double digit upside in stock price in next 24 months driven by key catalysts, we give a “Buy” on BAC at the current price of $28.43.
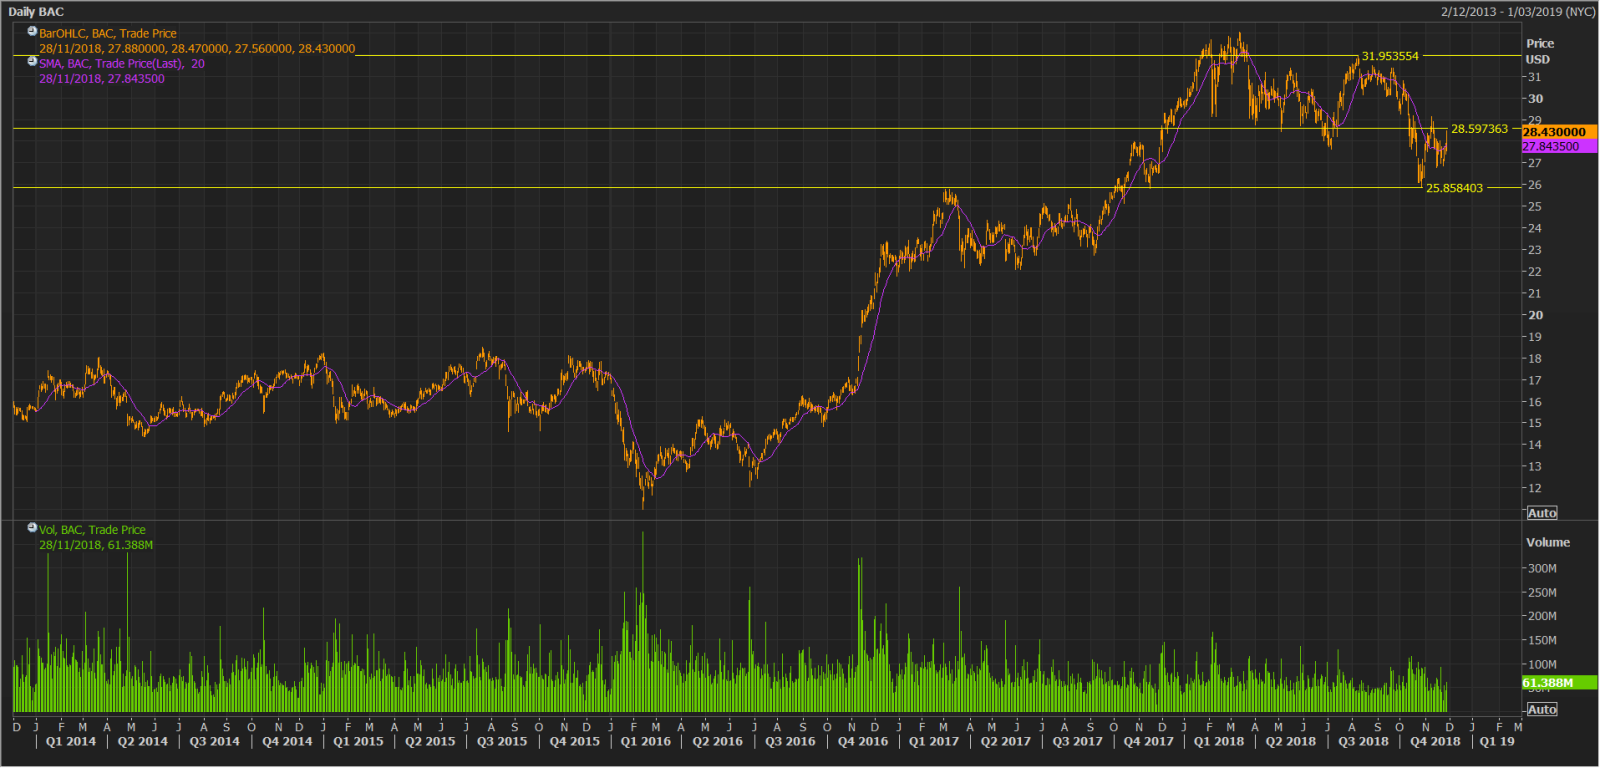
BAC Daily Chart (Source: Thomson Reuters)
Disclaimer
The advice given by Kalkine Pty Ltd and provided on this website is general information only and it does not take into account your investment objectives, financial situation or needs. You should therefore consider whether the advice is appropriate to your investment objectives, financial situation and needs before acting upon it. You should seek advice from a financial adviser, stockbroker or other professional (including taxation and legal advice) as necessary before acting on any advice. Not all investments are appropriate for all people. Kalkine.com.au and associated websites are published by Kalkine Pty Ltd ABN 34 154 808 312 (Australian Financial Services License Number 425376). The information on this website has been prepared from a wide variety of sources, which Kalkine Pty Ltd, to the best of its knowledge and belief, considers accurate. You should make your own enquiries about any investments and we strongly suggest you seek advice before acting upon any recommendation. Kalkine Pty Ltd has made every effort to ensure the reliability of information contained in its newsletters and websites. All information represents our views at the date of publication and may change without notice. To the extent permitted by law, Kalkine Pty Ltd excludes all liability for any loss or damage arising from the use of this website and any information published (including any indirect or consequential loss, any data loss or data corruption). If the law prohibits this exclusion, Kalkine Pty Ltd hereby limits its liability, to the extent permitted by law to the resupply of services. There may be a product disclosure statement or other offer document for the securities and financial products we write about in Kalkine Reports. You should obtain a copy of the product disclosure statement or offer document before making any decision about whether to acquire the security or product. The link to our Terms & Conditions has been provided please go through them and also have a read of the Financial Services Guide. On the date of publishing this report (mentioned on the website), employees and/or associates of Kalkine Pty Ltd do not hold positions in any of the stocks covered on the website. These stocks can change any time and readers of the reports should not consider these stocks as advice or recommendations.
 CA
CA  AU
AU UK
UK US
US NZ
NZ Please wait processing your request...