RY 144.17 0.4529% TD 77.39 0.0517% SHOP 78.87 -1.3878% CNR 171.64 0.5625% ENB 50.09 -0.4769% CP 110.62 0.6277% BMO 128.85 -0.548% TRI 233.58 1.1563% CNQ 103.29 -0.174% BN 60.87 -0.2295% ATD 75.6 -1.447% CSU 3697.0 1.1582% BNS 65.76 -0.3485% CM 66.6 -0.5525% SU 54.21 1.1569% TRP 53.15 0.3398% NGT 58.54 -0.3405% WCN 226.5 0.4123% MFC 35.905 0.9986% BCE 46.75 -0.5954%
Company Overview: Dell Technologies Inc., formerly Denali Holding Inc., is a provider of information technology solutions. The Company operates through two segments: Client Solutions and Enterprise Solutions Group (ESG). The Client Solutions segment includes sales to commercial and consumer customers of desktops, thin client products and notebooks, as well as services and third-party software and peripherals closely tied to the sale of Client Solutions hardware. Its offerings include hardware, such as desktop personal computers, notebooks and tablets, and peripherals, such as monitors, printers and projectors, as well as third-party software and peripherals. It also offers cloud-enabled data analytics and infrastructure management services. The ESG segment includes servers, networking and storage, as well as services and third-party software and peripherals that are closely tied to the sale of ESG hardware. It designs, develops, manufactures, markets, sells and supports a range of products and services.
(ROE* Figures for FY19)
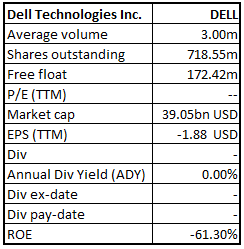
DELL Details
Transformation Plan on Track: Dell Technologies Inc (NYSE: DELL), is a US-based leading IT company that manufactures hardware & provides services. The company operates with significant scale and an unmatched breadth of unique and complementary offerings. The Dell Technologies family includes Dell, Dell EMC, Pivotal, RSA, Secureworks, Virtustream, and VMware. With digital transformation becoming essential to the businesses, the company has been expanding its portfolio to include holistic solutions enabling its customers to drive their ongoing digital transformation initiatives. Dell’s integrated solutions lead to a modern IT infrastructure, workforce transformation, and critical security solutions to the customers. The company recently released 1QFY20 results, turning into profit from the losses in the last few quarters. As per the management, DELL has estimated FY20 revenue to be in the range of $92.7 billion to $95.7 billion, exhibiting a growth between 2.3% to 5.6% as compared to fiscal 2019. This projection had included VMware’s contribution towards the company’s topline as DELL is the major holder of it. From the analysis standpoint, the company's revenue has grown at a CAGR of ~13.7% over the period of FY15-FY19. Going forward, the Management expects revenue to record a Y-o-Y growth in the range of 2.3% to 5.6% in FY20. With this, we expect the CAGR growth in revenue for the period FY15-FY20E at 11.4%.
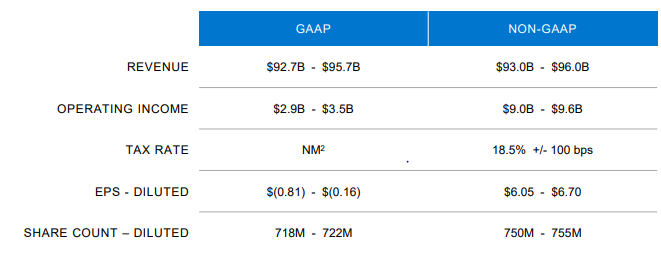
FY20 Financial Guidance (Source: Company Reports)
Turnaround Performance in 1QFY20: The company recently, posted results for the first quarter of FY20, witnessing a turnaround performance as Dell turned into profit from the losses in the last few quarters. Net income stood at $329 million, recording a Y-o-Y growth of 161%. The net income attributable to the company at $293 million in 1QFY20 as compared to a loss of $636 million in 1QFY19, witnessed an exuberant growth of 146%. During the quarter, operating profit of $550 million as compared to the operating loss of $153 million in 1QFY19 saw an increase of whopping 459%. Adjusted earnings per share (EPS) during the quarter stood at $1.45.
Non-GAAP Performance in 1QFY20: The company reported adjusted revenue growth of 2.6% to $21.9 billion in 1QFY20.The top-line was affected, primarily due to declined demand from various industries in China. The company delivered a growth of 7% in the Non-GAAP gross profit to $7.4 billion on year-on-year (y-o-y) basis. Consequently, gross margin expanded by 169 bps to 33.8% in Q1FY20 on Y-o-Y basis, due to fall in component costs along with balanced pricing in both servers and PCs. Non-GAAP operating expenses rose 7% (Y-o-Y) to $5.24 billion due to the continued investment in sales coverage. Operating expenses, as a percentage of revenues, in 1QFY20 expanded by 110 bps to 23.8% (Y-o-Y), however, declined sequentially. Non-GAAP operating income in 1QFY20 witnessed a growth of 8% to $2.2 billion from 1QFY19. Operating margin also expanded by 60 bps to 10% (Y-o-Y). Adjusted EBITDA increased by 8% to $2.6 billion during the quarter, with the adjusted EBITDA margin expanding by 60 bps to 11.7% (Y-o-Y).

Consolidated Non-GAAP Financial Highlights (Source: Company Reports)
Balance Sheet and Cash Flow Position at the end of 03 May 2019: Cash, cash equivalents & investments came in at $9.8 billion at the end of the first quarter of fiscal 2020. During the period, the company’s cash flow from operations was at $682 million and adjusted free cash flow stood at $116 million.
Performance of Key Segments in 1QFY20:
(A) Infrastructure Solutions Group (ISG): Revenue for 1QFY20 at $8.2 billion saw a Y-o-Y decrease of 5%, primarily driven by a 1% decline in storage revenue to $4.0 billion and a 9% decline in server and networking revenue to $4.2 billion. Operating income at $843 million during the quarter stood at 10.3% of Infrastructure Solutions Group revenue, down 50 bps Y-o-Y, due to investments in sales coverage, which offset higher gross margins.

Infrastructure Solutions Group Performance (Source: Company Reports)
(B) VMware: The segment witnessed another strong quarter by delivering $2.3 billion of revenue, up 13% on Y-o-Y basis. The growth was driven by broad-based strength across a diverse product portfolio. Operating income for the segment stood at $614 million, representing 26.9% of revenue. Based on VMware’s standalone results, the company generated license bookings growth in all product categories, with NSX and vSAN posting a Y-o-Y growth of over 40% and 50%, respectively.
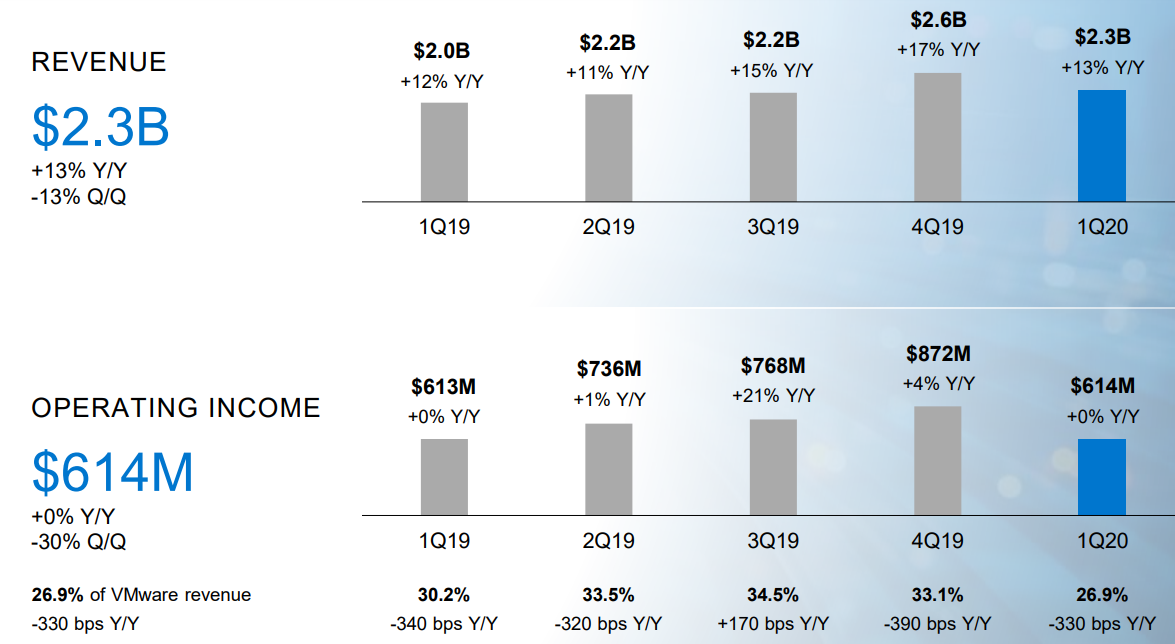
VMware Segment Performance (Source: Company Reports)
(C) Client Solutions Group (CSG): Revenue for the quarter at $10.9 billion was up 6%, with strong Commercial performance, driven by coverage expansion and the Windows 10 refresh cycle. Commercial revenue grew 13% to $8.3 billion, whereas Consumer revenue was down 10% to $2.6 billion. Operating income stood at $793 million for the quarter, representing 7.3% of Client Solutions Group revenue. The segment witnessed better profitability due to component cost declines, higher Commercial mix, and pricing discipline.

Client Solutions Group Performance (Source: Company Reports)
Restructuring Debt, Capital Management: In FY20, DELL plans to repay the gross debt of approximately $4.8 billion, which is on track. This payment is planned through the use of cash and free cash flow generated by the company. At the end of 1Q FY20, core debt stood at $38.6 billion, and the net core debt stood at $33.2 billion. Dell paid down approximately $400 million in gross debt in the first quarter and approximately $15 billion in gross debt over the two and a half years since the closing of the EMC transaction. This excludes debt related to Dell Financial Services, public subsidiary debt, and debt taken by the company for financing the Class V transaction. Overall, DELL has refinanced the debt of approximately $6 billion. As a result, the company has freed the cash flow for fiscal 2020 for repaying longer-dated debt and to reduce the long-term maturities debt due in 2021 and 2023.
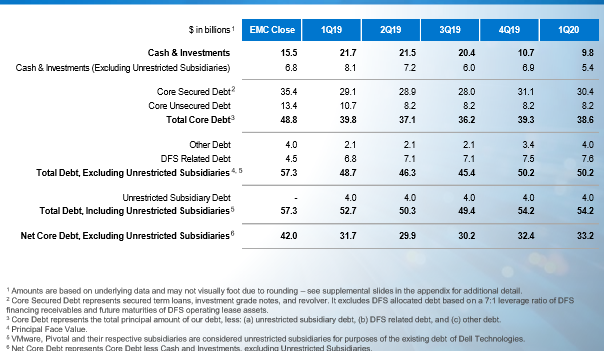
Capital Structure (Source: Company Reports)
New Offerings: DELL has recently launched the Dell Technologies Cloud, which is a new set of cloud infrastructure solutions for making simpler hybrid cloud environments. During the first quarter of 2020, the company came up with a new offering, i.e., Data Center-as-a-Service, which will make simple use of public cloud service consumption to an on-premise environment. Further, the company has expanded partnership with Microsoft to enable DELL’s customers to extend their on-premise VMware cloud environments to Azure. Moreover, during the quarter, Dell announced the industry's first jointly engineered hybrid cloud infrastructure stack, which will bring VxRail and VMware Cloud Foundation together at the same platform.
Top 10 Shareholders: The top 10 shareholders have been highlighted in the table, which together form around 47.01% of the total shareholding. The Temasek Holdings Pte. Ltd. and Dodge & Cox hold the maximum interest in the company at 10.50% and 8.34%, respectively.
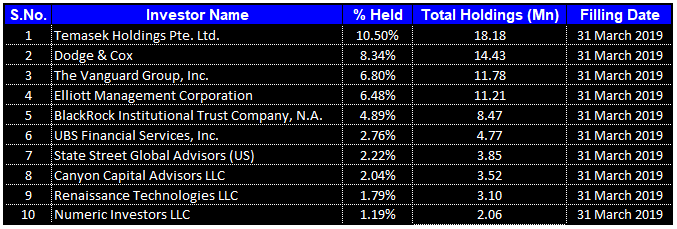
Top 10 Shareholders (Source: Thomson Reuters)
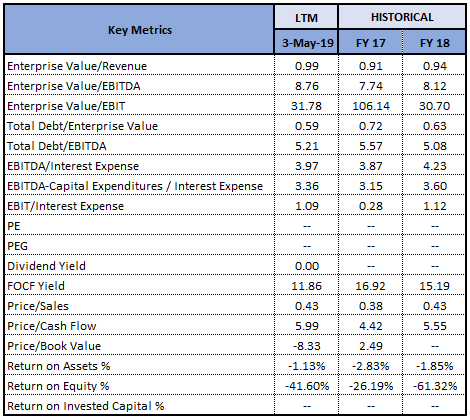
Key Metrics: The company posted healthy margins in the first quarter of FY2020. Gross and net margins for 1QFY20 stood at 31.0% and 1.5%, showing an improvement over 4QFY19 and 1QFY19, however, remained below the industry median of 41.8% and 2.4%, respectively. EBITDA margin for 1QFY20 came in at 10.6%, lower as compared to 11.3% in 1QFY19 whereas mildly higher against the industry median of 10.5%.
.png)
Key Metrics (Source: Thomson Reuters)
Positive Industry Outlook: Due to the strong ongoing digital transformation, there is a huge demand for technology-driven investments. According to the latest IDC forecast for IT spending till 2022, excluding the telecom sector, the investments are expected to grow by more than 2x real GDP. This investment will be driven by the strong rise of data and data-centric workloads, which will result to get better outcomes from the business. In order to avail this opportunity, DELL is investing in solutions and innovations.
Key Valuation Metrics (Source: Thomson Reuters)
Valuation Methodology:
Method 1: Price to Cash Flow Multiple Approach (NTM):
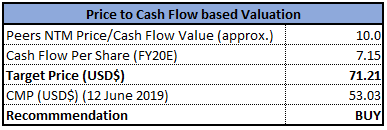
Price/Cash Flow Based Valuation (Source: Thomson Reuters), *NTM-Next Twelve Months
Method 2: EV/EBITDA Multiple Approach (NTM):
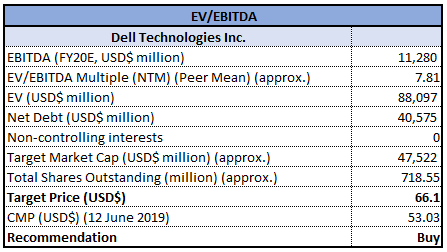
EV/EBITDA Based Valuation (Source: Thomson Reuters), *NTM-Next Twelve Months
Method 3: EV/Sales Multiple Approach (NTM):
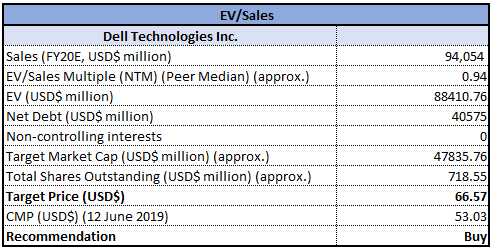
EV/Sales Based Valuation (Source: Thomson Reuters), *NTM-Next Twelve Months
Note: All forecasted figures and peers have been taken from Thomson Reuters, *NTM-Next Twelve Months
Stock Recommendation: At the current market price of $53.03, the stock has support at $49 level and resistance at $70. During the first quarter of fiscal 2020, DELL posted mixed results. However, the company made the turnaround to profit from loss reported in the corresponding period last year. With the operating profit growth (Y-o-Y) of whopping 459% in 1QFY20, continuous debt reduction on the balance sheet, new product offerings, strong foothold in the industry, etc., we are optimistic on the company and expect Dell to capture new growth, going forward. Based on the foregoing, we have valued the stock using the three relative valuation methods, Price to Cash flow, EV/EBITDA, and EV/Sales multiple and arrived at the target price in the ambit of $66 to $71.2 (double-digit upside (%)). Hence, we recommend a “Buy” rating on the stock at the current market price of $53.03 per share (down, 2.41% on 12 June 2019).
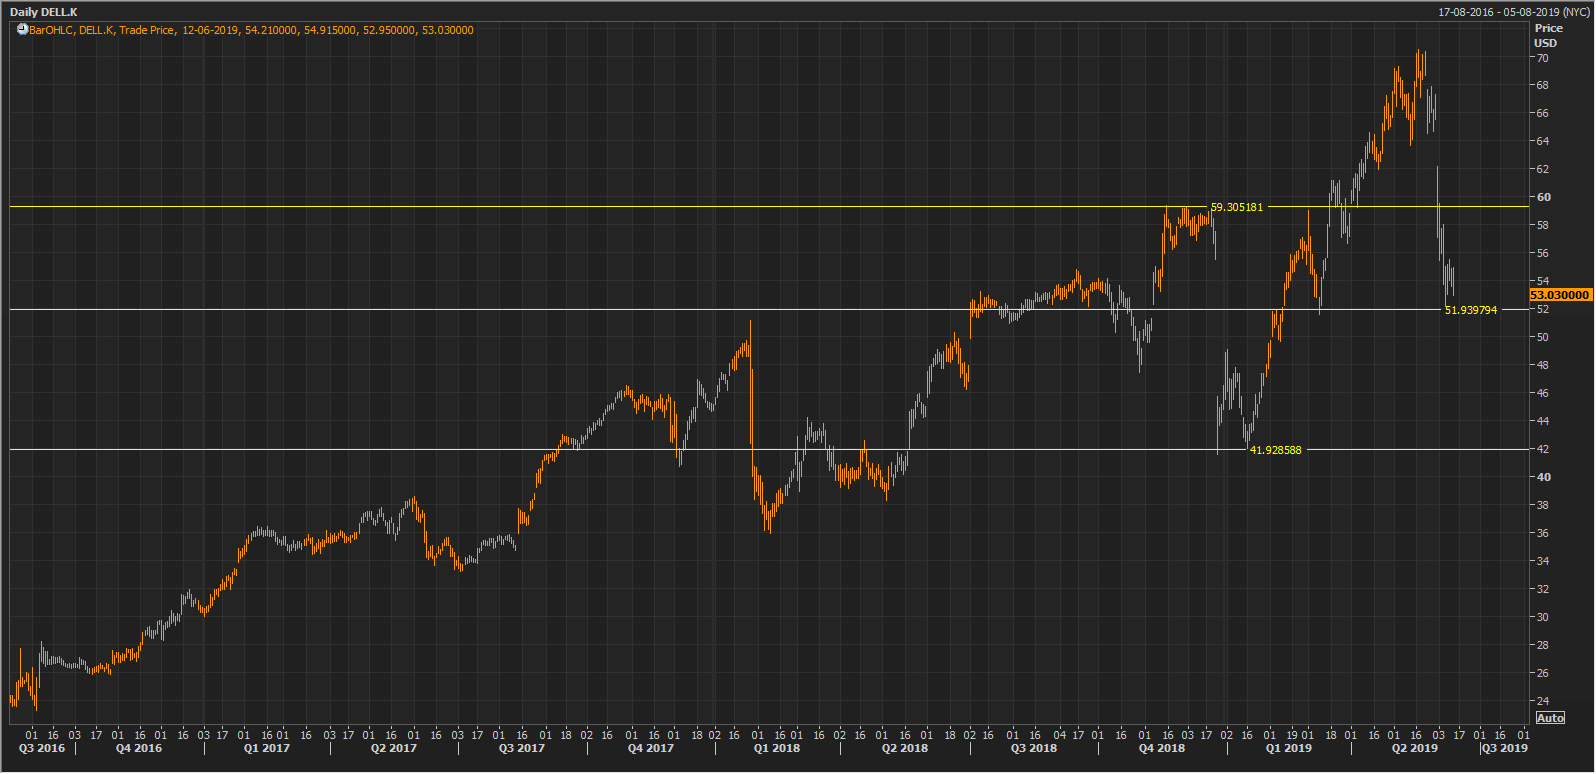
DELL Daily Chart (Source: Thomson Reuters)
Disclaimer
The advice given by Kalkine Pty Ltd and provided on this website is general information only and it does not take into account your investment objectives, financial situation or needs. You should therefore consider whether the advice is appropriate to your investment objectives, financial situation and needs before acting upon it. You should seek advice from a financial adviser, stockbroker or other professional (including taxation and legal advice) as necessary before acting on any advice. Not all investments are appropriate for all people. Kalkine.com.au and associated websites are published by Kalkine Pty Ltd ABN 34 154 808 312 (Australian Financial Services License Number 425376). The information on this website has been prepared from a wide variety of sources, which Kalkine Pty Ltd, to the best of its knowledge and belief, considers accurate. You should make your own enquiries about any investments and we strongly suggest you seek advice before acting upon any recommendation. Kalkine Pty Ltd has made every effort to ensure the reliability of information contained in its newsletters and websites. All information represents our views at the date of publication and may change without notice. To the extent permitted by law, Kalkine Pty Ltd excludes all liability for any loss or damage arising from the use of this website and any information published (including any indirect or consequential loss, any data loss or data corruption). If the law prohibits this exclusion, Kalkine Pty Ltd hereby limits its liability, to the extent permitted by law to the resupply of services. There may be a product disclosure statement or other offer document for the securities and financial products we write about in Kalkine Reports. You should obtain a copy of the product disclosure statement or offer document before making any decision about whether to acquire the security or product. The link to our Terms & Conditions has been provided please go through them and also have a read of the Financial Services Guide. On the date of publishing this report (mentioned on the website), employees and/or associates of Kalkine Pty Ltd do not hold positions in any of the stocks covered on the website. These stocks can change any time and readers of the reports should not consider these stocks as advice or recommendations.
 CA
CA  AU
AU UK
UK US
US NZ
NZ Please wait processing your request...