RY 144.17 0.4529% TD 77.39 0.0517% SHOP 78.87 -1.3878% CNR 171.64 0.5625% ENB 50.09 -0.4769% CP 110.62 0.6277% BMO 128.85 -0.548% TRI 233.58 1.1563% CNQ 103.29 -0.174% BN 60.87 -0.2295% ATD 75.6 -1.447% CSU 3697.0 1.1582% BNS 65.76 -0.3485% CM 66.6 -0.5525% SU 54.21 1.1569% TRP 53.15 0.3398% NGT 58.54 -0.3405% WCN 226.5 0.4123% MFC 35.905 0.9986% BCE 46.75 -0.5954%
Company Overview: Facebook, Inc. is focused on building products that enable people to connect and share through mobile devices, personal computers and other surfaces. The Company's products include Facebook, Instagram, Messenger, WhatsApp and Oculus. Facebook enables people to connect, share, discover and communicate with each other on mobile devices and personal computers. Instagram enables people to take photos or videos, customize them with filter effects, and share them with friends and followers in a photo feed or send them directly to friends. Messenger allows communicating with people and businesses alike across a range of platforms and devices. WhatsApp Messenger is a messaging application that is used by people around the world and is available on a range of mobile platforms. Its Oculus virtual reality technology and content platform offers products that allow people to enter an interactive environment to play games, consume content and connect with others.

FB Details (ROE* figure for 1Q FY19)
A Center Point to Connect Community, Facebook, Inc. (NASDAQ: FB) reported healthy earnings for the first quarter of 2019. The business and the community continue to grow as FB aims to build out privacy-focused vision for the future of social networking and is working collaboratively to address important issues around the internet. Healthy yoy (Year over Year) growth of daily active users and monthly active users with an increasing percentage of mobile advertising revenue remain the key highlights of the reported quarterly results.
Strong Performance in Q1FY19: The company had reported the adjusted revenue growth of 26 percent to $15.08 billion in the first quarter of FY 19. Advertising revenue grew 26% or 31% on a constant currency basis to $14.91 billion in 1Q FY19. During the first quarter of 2019, the revenue from Payments & Other Fees declined by 4% to $165 million on Y-o-Y basis and has fallen by 40% sequentially from the fourth quarter of FY 18 which had received the benefit from holiday sales of Oculus and Portal. During 1QFY19, Mobile ad revenue rose by 30% yoy to $13.9 billion, which forms ~93% of FB’s total ad revenue. Moreover, for the first quarter of 2019, FB has reported 80% rise in the total expenses of $11.8 billion, including the accrual of $3 billion. During the first quarter, the company has reported the operating income of $3.3 billion, which means that the company has posted the operating margin of 22%. If the provision of accrual would have excluded, the operating margin would have been 20% points higher. For the first quarter of FY19, the company has reported that the net income was $2.4 billion, which equates earnings per share of $0.85. The accrual of $3 billion which the company had recorded has reduced the earnings per share by approximately $1.04. During the quarter, the company had incurred the capex of $4 billion, which is primarily on the back of investments made by the company in data centers, servers, office facilities, and network infrastructure. FB during the first quarter of 2019, had generated the free cash flow of $5.3 billion and ended the first quarter with cash and investments and marketable securities of approximately $45.2 billion. Additionally, during the first quarter of FY 19, FB had bought back approximately $521 million of the company’s Class A common stock.
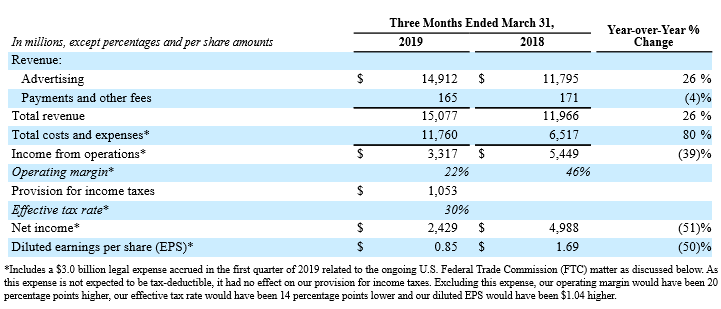
First Quarter of FY19 Financial Highlights (Source: Company Reports)
The company has set aside $3 billion during the first quarter to cover the loss in expectation of a fine related to an inquiry by the U.S. Federal Trade Commission. The company had projected that the loss related to any settlement could be in the range of $3 billion to $5 billion. Daily active users have grown by 8% in the first quarter to 1.56 billion. The daily active users’ growth in comparison to the last year, is on back of the growth witnessed by countries such as India, Indonesia, and the Philippines. Monthly active users also rose 8% to 2.38 billion during the first quarter with average revenue per user grew to $6.42.
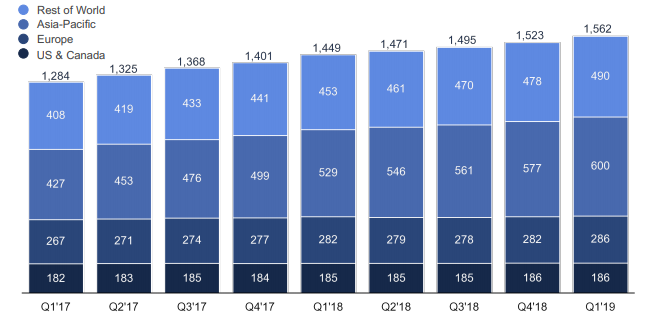
Daily Active Users in Million (Source: Company Reports)
Top 10 Shareholders: The top 10 shareholders have been highlighted in the table which together form around 33.44% of the total shareholding. The Vanguard Group, Inc and Fidelity Management & Research Company hold maximum interest in the company at 7.38% and 4.72%, respectively.
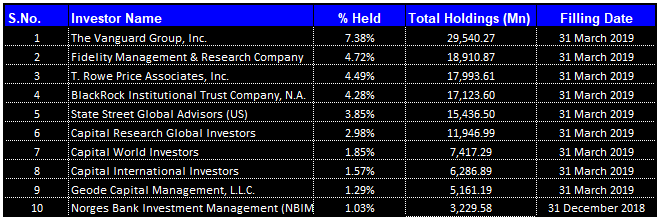
Top 10 Shareholders (Source: Thomson Reuters)
General Trend Experienced by FB During the first quarter of FY 19: In terms of geographical ad revenue growth, US & Canada posted the strongest growth of 30%, followed by Asia-Pacific that posted 28% growth and Rest of World posted the growth of 23%. Europe has posted the slowest growth of 21% as it got affected in part by currency headwinds. During the first quarter of 2019, the average price per ad had declined by 4% and the number of ad impressions served across the company’s whole range of services grew 32%. Impression growth was achieved by ads on Instagram Stories, Instagram Feed, and FB News Feed. FB has posted the yoy decrease in average price per ad due to the ongoing shift in portfolio mix towards Stories ads and geographies that attracts at lower rates. Further, during the first quarter of 2019, the company’s top 100 advertisers form less than 20% of total ad revenue, which reflects that the company has diversified its advertiser base more compared to the same period last year. Currently, Facebook and Instagram feed ads make up the majority of the company’s business today. However, stories are forming an increasingly important growth opportunity. FB currently, holds 3 million advertisers that are making use of Stories ads to contact the customers across Instagram, Facebook, and Messenger. Commerce is a rising area for FB as it is experiencing millions of communications between buyers and sellers in Marketplace every day. Additionally, during the first quarter of FY19, the company had launched Collaborative Ads, which allows the brands that do not have a direct-to-consumer channel the platform for running e-commerce campaigns with the retailers. Recently, Samsung had tested Collaborative Ads with Fravega, which is an electronics retailer in Argentina. They targeted consumers that had watched Samsung products on the website of retailer. This campaign has provided a 21% rise to the top line. Meanwhile, the company is working towards the integration of the messaging functions of WhatsApp, Messenger and Instagram, FB expects that the Messenger and WhatsApp will come out as the main way for the customers to interact on the FB network. Currently, ~2.7 billion people are using Facebook, Instagram, WhatsApp or Messenger each month, and it has been estimated that more than 2.1 billion people are using at least one every day. Further, towards the end of the first quarter of FY 19, FB had rolled out a new feature called Instagram Checkout, which allows the customers to buy products that they see on Instagram from within that app.
Key Metrics: The company has enjoyed healthy gross margin and EBITDA margin at 81.3% and 50.9% in 1QFY19 which are above the industry median of 75.6% and 9.5%, respectively. Net margin at 16.1% and ROE at 2.8% are also above the industry median of 2.8% and 0.6%, respectively.
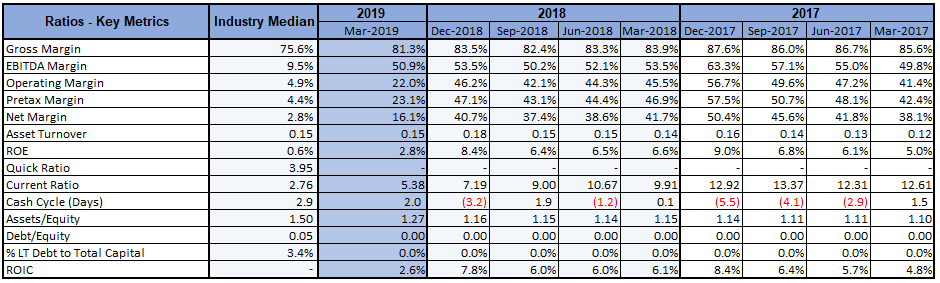
Key Metrics (Source: Thomson Reuters)
Nomination of Personnel: FB has nominated Peggy Alford, Senior Vice President, Core Markets of PayPal Holdings, Inc., for the election to the FB's board of directors at its annual meeting of shareholders which is scheduled to be held on May 30th, 2019. Meanwhile, the company at the end of the first quarter of 2019 has posted a 36% rise in the headcount to about 37,700.
Future Outlook: For the second quarter of FY 19, FB expects the revenue growth rates to decline sequentially throughout FY 19 on a constant currency basis; however the long-term outlook on performance is on a positive side. For FY 19, the total expenses are expected to grow in the range of 47-55% compared to 2018 after including the accrual that FB had recorded in the first quarter, up from the prior projection of 40-50% growth. The $3Bn accrual form about 10% points of the expected expense growth. The company has updated the outlook for 2019 capital expenditures and expects it to be in the range of $17-19 billion, down from the company’s previous projection of $18-20 billion. The company will incur capex on the back of the continued investment in data centers and servers. FB anticipates that the tax rate for the rest quarters of FY19 is likely to be in the mid-teens.
The mid- to long-term outlook is set on the back of group’s balance sheet that stays strong with support coming from cash flow health. Despite latest challenges, the earnings growth is expected to boost the stock in the next 12-24 months with revenue growth still expected to be in high single digits for the next couple of years, as per consensus estimates. In fact, the group is expected to overall benefit from the business model that is based on social media related engagements and advertising.
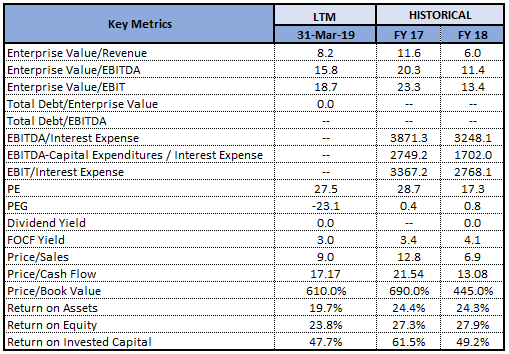
Key Valuation Metrics (Source: Thomson Reuters)
Valuation Methodology:
Method 1: Price to Book Value Multiple Approach (NTM):
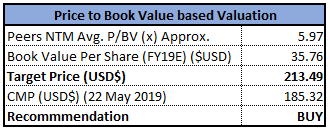
Price/Book Value Based Valuation (Source: Thomson Reuters), *NTM-Next Twelve Months
Method 2: EV/Sales Multiple Approach (NTM):
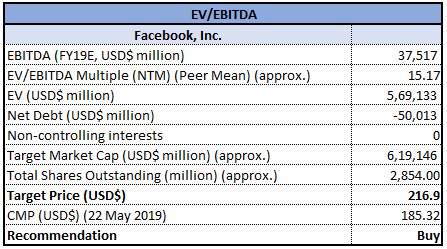
EV/EBITDA Multiple Approach (Source: Thomson Reuters)
Note: All forecasted figures and peers have been taken from Thomson Reuters, *NTM-Next Twelve Months
Stock Recommendation: FB stock is trading at a price of $185.32, has support at $178.05 level and resistance at $197.8. The company has posted strong results for the first quarter of FY 19. The company has even made the accrual of $3 billion to cover the losses that will arise from a fine related to an inquiry by the U.S. Federal Trade Commission, which resulted in 80% rise in expenses during the first quarter 2019. Moreover, the company is observing opportunity in stories which are growing and will become a major contributor for revenue, going forward. Stories ads were the biggest contributor to the growth of ad impression in the first quarter of 2019. Considering the aforesaid parameters and outlook of the business, we give a “Buy” recommendation on the stock at the current market price of $185.32 per share (up 0.11% on 22 May 2019).
Charts.png)
FB Daily Chart (Source: Thomson Reuters)
Disclaimer
The advice given by Kalkine Pty Ltd and provided on this website is general information only and it does not take into account your investment objectives, financial situation or needs. You should therefore consider whether the advice is appropriate to your investment objectives, financial situation and needs before acting upon it. You should seek advice from a financial adviser, stockbroker or other professional (including taxation and legal advice) as necessary before acting on any advice. Not all investments are appropriate for all people. Kalkine.com.au and associated websites are published by Kalkine Pty Ltd ABN 34 154 808 312 (Australian Financial Services License Number 425376). The information on this website has been prepared from a wide variety of sources, which Kalkine Pty Ltd, to the best of its knowledge and belief, considers accurate. You should make your own enquiries about any investments and we strongly suggest you seek advice before acting upon any recommendation. Kalkine Pty Ltd has made every effort to ensure the reliability of information contained in its newsletters and websites. All information represents our views at the date of publication and may change without notice. To the extent permitted by law, Kalkine Pty Ltd excludes all liability for any loss or damage arising from the use of this website and any information published (including any indirect or consequential loss, any data loss or data corruption). If the law prohibits this exclusion, Kalkine Pty Ltd hereby limits its liability, to the extent permitted by law to the resupply of services. There may be a product disclosure statement or other offer document for the securities and financial products we write about in Kalkine Reports. You should obtain a copy of the product disclosure statement or offer document before making any decision about whether to acquire the security or product. The link to our Terms & Conditions has been provided please go through them and also have a read of the Financial Services Guide. On the date of publishing this report (mentioned on the website), employees and/or associates of Kalkine Pty Ltd do not hold positions in any of the stocks covered on the website. These stocks can change any time and readers of the reports should not consider these stocks as advice or recommendations.
 CA
CA  AU
AU UK
UK US
US NZ
NZ Please wait processing your request...