RY 144.17 0.4529% TD 77.39 0.0517% SHOP 78.87 -1.3878% CNR 171.64 0.5625% ENB 50.09 -0.4769% CP 110.62 0.6277% BMO 128.85 -0.548% TRI 233.58 1.1563% CNQ 103.29 -0.174% BN 60.87 -0.2295% ATD 75.6 -1.447% CSU 3697.0 1.1582% BNS 65.76 -0.3485% CM 66.6 -0.5525% SU 54.21 1.1569% TRP 53.15 0.3398% NGT 58.54 -0.3405% WCN 226.5 0.4123% MFC 35.905 0.9986% BCE 46.75 -0.5954%

Company Overview: Lennar Corporation is a provider of real estate related financial services, commercial real estate, investment management and finance company. The Company is a homebuilder that operates in various states. Its segments include Homebuilding East, Homebuilding Central, Homebuilding West, Lennar Financial Services, Rialto and Lennar Multifamily. It is a developer of multifamily rental properties. Its Homebuilding operations include the construction and sale of single-family attached and detached homes, as well as the purchase, development and sale of residential land. It operates primarily under the Lennar brand name. The Lennar Financial Services segment includes mortgage financing, title insurance and closing services for both buyers of its homes and others. The Rialto segment is a real estate, investment management, and finance company. The Lennar Multifamily segment focuses on developing a portfolio of institutional multifamily rental properties in the United States markets.
.png)
LEN Details
Lennar Corp (NYSE: LEN) has been tracking well with regards to the increased confidence in terms of the group’s ability to manage costs and grow the business post the acquisition of CalAtlantic Group. Monetization of Rialto segment can also add value while the group expects some improvements in performance going forward. Meanwhile, gain in market share and potential cost savings are key catalysts to growth trajectory.
Completes Strategic Acquisition of CalAtlantic: Lennar has finished the previously-announced strategic combination with CalAtlantic Group, Inc. The shareholders have approved the merger and the Certificate of Merger filed in Delaware. The merger would form the nation's leading homebuilder and the combination would have benefits from overall economic strength, driven by low unemployment, rising wages, favorable tax reform, higher consumer confidence and strong housing demand. This merger further enables the company to use local market concentration to drive synergies and efficiencies in the most strategic markets in the country. Moreover, all of the CalAtlantic associates are joining LEN, including Scott Stowell, currently CalAtlantic's Executive Chairman of the Board, who will join LEN’s Board of Directors and Jeff McCall, currently CalAtlantic's Chief Financial Officer, who will become the company’s new Senior Vice President focusing on corporate services. Further, LEN would own or control approximately 250,000 home sites and be actively selling homes in approximately 1,300 residential communities in 21 states. In recent fiscal year, LEN has delivered 29,394 single family homes and CalAtlantic delivered 14,602 single family homes. Additionally, as per the merger agreements, CalAtlantic stockholders would get each share of CalAtlantic common stock, 0.885 shares of Lennar Class A common stock and 0.0177 shares of Lennar Class B common stock. The merger consideration consists of over $1.16 billion in cash, 82,731,943 shares of Lennar Class A common stock and 1,654,639 shares of Lennar Class B common stock. Based on closing prices reported on the New York Stock exchange on February 9, 2018, the value of the Lennar Class A and Class B common stock that would be issued in the merger has totaled $4.9 billion. In addition, of the existing 566 CalAtlantic communities, approximately 41% will remain CalAtlantic, 50% will be rebranded to LEN over the next several quarters, and the remaining 9% rebranded to Village Builder or WCI, which are the Design Center brands. Therefore, all future communities will be sold under the Lennar, WCI or Village Builder brands. Furthermore, LEN expects to realize at least $75 million and $250 million in synergies in FY18 and FY19, respectively. Overall, Len expects $100 million and $365 million in fiscal years 2018 and 2019, respectively. The majority of these synergies, $265 million in 2019, will come from lower direct construction costs.
.png)
Revenues and Earnings (Source: Company Reports)
Fourth Quarter of 2017 Performance highlights: The group has posted net earnings of $309.6 million or $1.29 per diluted share in the fourth quarter of FY 17. The company’s core operational metrics has exceeded the company’s expectations. Excluding the strategic one-time transaction that Stuart highlighted shifted into the first quarter of 2018, LEN would have exceeded the consensus estimate of $1.47 by 4 cents. This compared to fourth quarter 2016 net earnings of $313.5 million or $1.31 per diluted share, which was favorably impacted by energy credits. Further, in the fourth quarter, revenues from home sales has increased 14%, driven by a 5% rise in wholly owned deliveries and 8% increase in average selling price to $387,000. At the beginning of the fourth quarter, the company was impacted by Hurricane Harvey and Hurricane Irma, and had reduced the fourth quarter projections by 950 deliveries. However, the operational team managed through this challenging period and were able to deliver approximately 400 of these 950 homes during the fourth quarter as operations return to normal. Moreover, LEN’s gross margin on home sales in the fourth quarter was 22.4%, which was better than the company’s stated goals. The prior year’s gross margin percentage was 23.3%. The gross margins had declined year-over-year due to increased land and construction costs, partially offset by an increase in average sale price. The sales incentives improved 50 basis points to 5.7% with the improvement driven by the Homebuilding West segment. The gross margin percentages were highest in the Homebuilding East segment, and direct construction costs rose by 7% year-over-year to approximately $57 per square foot due to approximately an 8% increase in labor and a 6% increase in material costs. The SG&A in the fourth quarter fell to 8.4% from 8.7% in the prior year. This was the lowest fourth quarter SG&A percentage in the company’s history. The improvement was primarily due to a decrease in external broker commissions as a percentage of revenue from home sales and improved operating leverage.
.png)
Deliveries and New Orders (Source: Company Reports)
Strong Financial Position: LEN’s balance sheet is decent. The group has a net debt to total capital of 34.4%, which is an increase of 100 basis points year-over-year despite acquiring WCI for $642 million in an all-cash transaction at the start of this year. The company has approximately $2.3 billion of cash and no outstanding borrowings on the $2-billion revolving credit facility. Moreover, in the fourth quarter of FY17, stockholders’ equity increased to $7.9 billion, and the book value per share grew to $32.81 per share.
Rialto segment highlights: The group’s Rialto segment delivered operating earnings of $2.2 million against $8 million in the prior year, both amounts are net of non-controlling interest. The investment management business contributed $46.4 million of earnings, which comprises $14.2 million of equity in earnings from the real estate funds and $32.2 million of management fees and other, which includes $10.9 million of carried interest distributions. As of the quarter end, the undistributed hypothetical carried interest for Rialto real estate Fund 1 and 2 now totals $119 million. Rialto mortgage finance operations contributed $368 million of commercial loans into core securitizations, leading to the earnings of $14.3 million from $622 million and $35.6 million in the prior year. The fall in earnings was on the back of decline in volume and lower margins, 3.8% in the current year against 5.8% in the prior year. On the other hand, for 2018, Rialto, is forecasted to deliver a range of profits of about $60 million and $65 million during the year. The second half of the year is expected to have higher profitability than the first half, while their first quarter is forecasted to be over $10 million.
Outlook for 2018: LEN in 2018 expects to deliver between 32,000 and 32,500 homes. The company expects a backlog conversion ratio of approximately 65% to 70% for the first quarter, 75% for the second and third quarters and over 90% for the fourth quarter. The 2018 operating margins are expected to be at the 2017 level of 12.9%. The full year gross margin is expected to be approximately 22% and SG&A approximately 9%. Moreover, the Financial Services are expected to be in the range of $160 million to $165 million for the year 2018. In the first half of 2018, the decline in refinance volume will continue as in 2017. Therefore, first quarter and second quarter are expected to result in lower year over-year earnings. However, it is expected that year-over-year earnings for the third and fourth quarter will be higher. Additionally, the effective tax rate for 2018 will be approximately 25%, excluding the one-time $70 million noncash deferred tax asset charge.
Stock performance: The shares of LEN delivered returns of over 18.9% in the last one year and the group believes that their operating strategies and strong earnings would lead to a healthy cash flow in 2018. The use of cash in 2018 would be prioritized to first reduce debt. We believe that the stock has more room for growth given the recent developments on acquisition and growth front, and rate a “Buy”” on the stock at the current price of $59.90
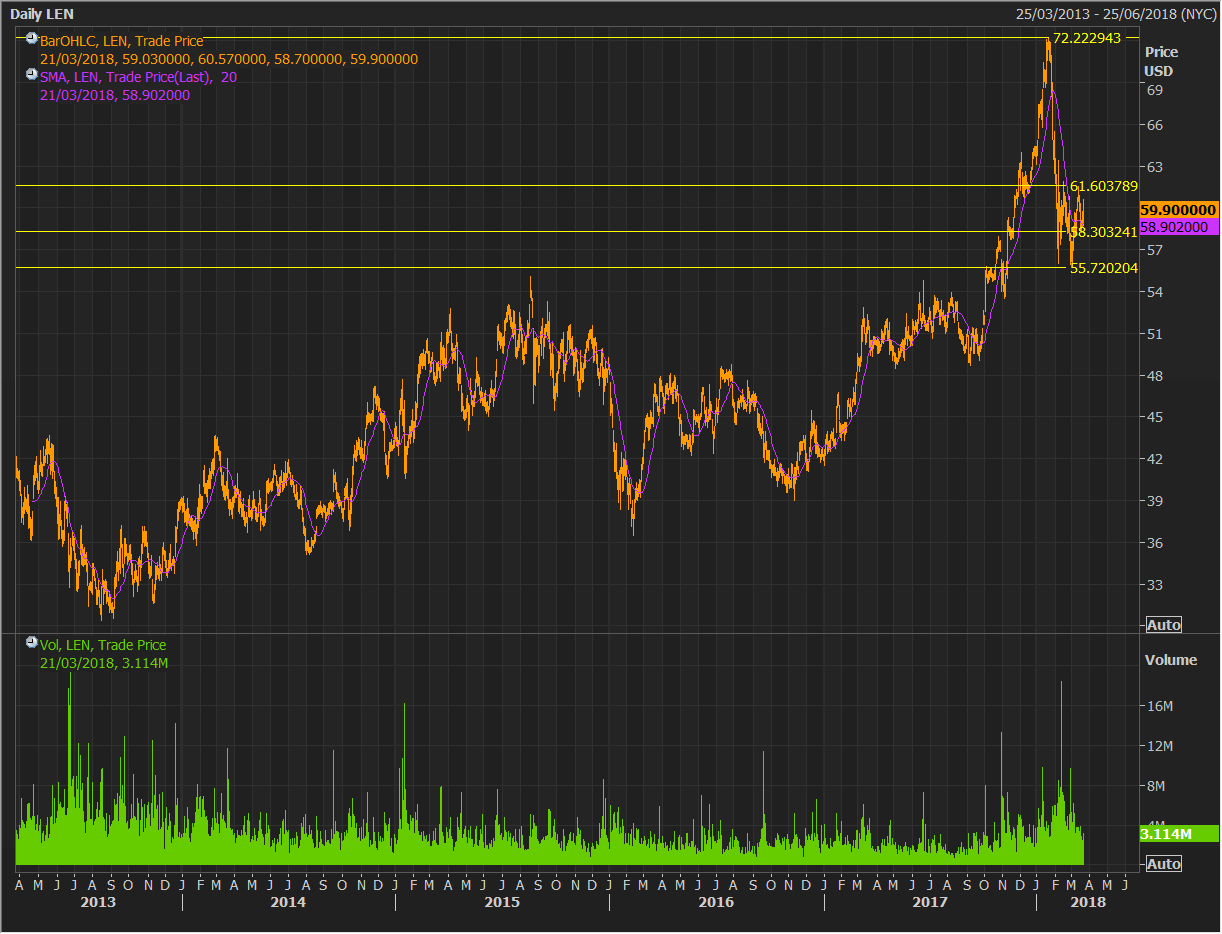
LEN Daily Chart (Source: Thomson Reuters)
Disclaimer
The advice given by Kalkine Pty Ltd and provided on this website is general information only and it does not take into account your investment objectives, financial situation or needs. You should therefore consider whether the advice is appropriate to your investment objectives, financial situation and needs before acting upon it. You should seek advice from a financial adviser, stockbroker or other professional (including taxation and legal advice) as necessary before acting on any advice. Not all investments are appropriate for all people. Kalkine.com.au and associated websites are published by Kalkine Pty Ltd ABN 34 154 808 312 (Australian Financial Services License Number 425376). The information on this website has been prepared from a wide variety of sources, which Kalkine Pty Ltd, to the best of its knowledge and belief, considers accurate. You should make your own enquiries about any investments and we strongly suggest you seek advice before acting upon any recommendation. Kalkine Pty Ltd has made every effort to ensure the reliability of information contained in its newsletters and websites. All information represents our views at the date of publication and may change without notice. To the extent permitted by law, Kalkine Pty Ltd excludes all liability for any loss or damage arising from the use of this website and any information published (including any indirect or consequential loss, any data loss or data corruption). If the law prohibits this exclusion, Kalkine Pty Ltd hereby limits its liability, to the extent permitted by law to the resupply of services. There may be a product disclosure statement or other offer document for the securities and financial products we write about in Kalkine Reports. You should obtain a copy of the product disclosure statement or offer document before making any decision about whether to acquire the security or product. The link to our Terms & Conditions has been provided please go through them and also have a read of the Financial Services Guide. On the date of publishing this report (mentioned on the website), employees and/or associates of Kalkine Pty Ltd do not hold positions in any of the stocks covered on the website. These stocks can change any time and readers of the reports should not consider these stocks as advice or recommendations
 CA
CA  AU
AU UK
UK US
US NZ
NZ Please wait processing your request...