RY 144.17 0.4529% TD 77.39 0.0517% SHOP 78.87 -1.3878% CNR 171.64 0.5625% ENB 50.09 -0.4769% CP 110.62 0.6277% BMO 128.85 -0.548% TRI 233.58 1.1563% CNQ 103.29 -0.174% BN 60.87 -0.2295% ATD 75.6 -1.447% CSU 3697.0 1.1582% BNS 65.76 -0.3485% CM 66.6 -0.5525% SU 54.21 1.1569% TRP 53.15 0.3398% NGT 58.54 -0.3405% WCN 226.5 0.4123% MFC 35.905 0.9986% BCE 46.75 -0.5954%
Company Overview: Salesforce.com, Inc. is a provider of enterprise software, delivered through the cloud, with a focus on customer relationship management (CRM). The Company focuses on cloud, mobile, social, Internet of Things (IoT) and artificial intelligence technologies. The Company's service offerings are configured and integrated with other platforms and enterprise applications. The Company delivers its service offerings via Internet browsers and on mobile devices. Its Customer Success Platform is a portfolio of service offerings providing sales force automation, customer service and support, marketing automation, digital commerce, community management, analytics, application development, IoT integration, collaborative productivity tools and its professional cloud services. Its cloud service offerings include Sales Cloud, Service Cloud, Marketing Cloud, Commerce Cloud, Community Cloud, Analytics Cloud, Salesforce Quip and Salesforce Platform.

CRM Details
Sales & Services crossing $1 Bn Revenue: Salesforce.com Inc (NASDAQ: CRM) is a global leader in CRM (customer relationship management) technology that enables companies to improve their relationships and interactions with customers. Salesforce empowers businesses and industries to connect with their customers in new ways through existing and emerging technologies, which involve cloud, mobile, social, IoT (Internet of Things) and AI (artificial intelligence).
The company derives revenues from two sources- subscription revenues and related professional services. Subscription revenues are further categorized into four divisions – (a) Sales Cloud, (b) Service Cloud, (c) Salesforce Platform and Other, (d) Marketing and Commerce Cloud. Subscription and support revenue represented ~93% of the total revenues for FY19. Related professional services offer the solutions related to process mapping, project management, implementation services, and other revenue.
Looking at the historical financial performance since 2015, the company has more than doubled its top-line from ~$5 billion in FY15 to ~$13 billion in FY19. Net income turned positive in FY17 to $0.32 million and crossed $1 billion in FY19. On balance sheet front, total assets also expanded from $10.7 billion in FY15 to $30.73 billion in FY19. The fiscal year 2019 was a record year for Salesforce, surpassing $13 billion in annual revenue and reaching the milestone with a faster pace. CRM strengthened its partnerships with Google and AWS and formed a brand-new partnership with Apple to deliver even more value to the client base. Relationships over $20 million grew 48% on pcp. Salesforce provides businesses a unified view across every touchpoint — sales, service, marketing, commerce, communities, integration, etc. The company is on track to organically double its top-line in next 4 years, with a new revenue projection range of $26 - $28 billion in FY2023.
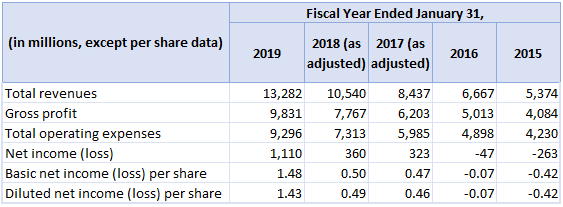
Financial Summary FY15-FY19 (Source: Company Reports)
1QFY20 Results Highlights: The company recently announced first quarter FY20 results with record top-line and phenomenal growth in operating cash flow. Total revenue for the quarter stood at $3.74 billion, posting a yoy growth of 24% and 26% in Constant Currency (CC). The exuberant growth in top-line was largely on account of massive demand for solutions witnessed by new and existing customers across the world and industry. Subscription and support revenue at $3.50 billion witnessed a growth of 24% on yoy. Professional services and other revenues reported a growth of 23% to $241 million during the quarter.

Q1 FY20 Financial Summary (Source: Company Reports)
Analysing the 1QFY20 revenue by Cloud Service Offering which is ‘subscription and support revenue’, Sales Cloud and Service Cloud reported the revenue of $1.11 billion and $1.0 billion with a yoy growth of more than 11% and 20%, respectively. Salesforce Platform and other, and Marketing Cloud & Commerce Cloud represented the revenue of $0.8 billion (up +46%, yoy) and $0.6 billion (up +33%, yoy), respectively.

Complete portfolio of CRM products (Source: Company Reports)
Region-wise Revenue Bifurcation: Analysing the revenues by geographical region, Americas accounted for ~70% of the total revenue amounted to $2,617 million, growing over 25%, yoy (+25% in CC). Revenue from EMEA at $755 million (yoy growth +25% & +32% in cc) accounted for ~20% and APAC revenue at $365 million (yoy growth of +22% & +27% in CC) represented ~10% of the total revenue.
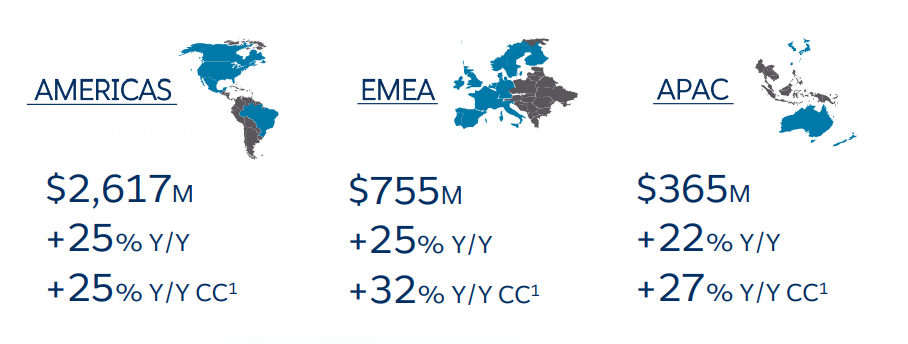
Q1 FY20 Revenue by Region (Source: Company Reports)
Remaining Performance Obligation: To brief about variant revenues, unearned revenue is comprised of billings/payments received in advance of revenue recognition from subscription services and is recognized as the revenue recognition criteria are met. Remaining performance obligations can be understood as future revenues, which are under contract but not recognized or recorded in unearned revenue. The company invoices its customers on annual basis. With this, the first and fourth quarters are usually the largest collections periods with decent operating cash flow whereas, second and third quarter face the seasonal effect with regards to collections and operating cash flows.
At the end of the period, the company posted a Y-o-Y growth of 22% in remaining performance obligation at ~$24.9 billion, including ~$500 million related to the remaining performance obligation from MuleSoft. Current remaining performance obligation at the end of the period, came in at ~$11.8 billion, a rise of 23% yoy (24% in CC).
.png)
Remaining Performance Obligation in 1QFY20 (Source: Company Reports)
GAAP diluted EPS (earnings per share) for the quarter, came in at $0.49 with non-GAAP diluted EPS of $0.93, variation attributable to mark-to-market accounting of the company’s strategic investments.
Cash generated from operations at $1.97 billion went up 34%, yoy, with total cash, equivalents and marketable valued at $6.38 billion. Free cash flow of $1.81 billion (up, 34% yoy) was led by lower capex at $159 million at the end of the quarter. As a business trend, 4th quarter tends to be the finest period for new business and renewals. Customers being invoiced annually, the 1st & 4th quarter are the largest collections and operating cash flow periods. Whereas, second and third quarter face the seasonal effect with regards to collections and operating cash flows.
.png)
Quarterly Operating Cash Flow (Source: Company Reports)
Key Metrics: The company enjoyed healthy margins in the first quarter of FY20. EBITDA margin at 17.3% was significantly higher than the last few quarters and industry median of 6.1%. Net margin at 10.5% was lower against 4QFY19 and 1QFY19, however, better than the industry median of -3.8%.On the same lines, ROE for 1QFY20 at 2.4% was lower than the previous quarter as well as corresponding period in last year but was higher than the industry median of -1.3%.
.png)
Key Ratio Metrics (Source: Thomson Reuters)
Additional Investment Rationale:
Strengthening Relationship with Clients: First quarter of FY20 was characterized by strengthening relationship with few leading companies which include Tokio Marine Holdings (one of Japan's largest insurance providers), Hera Group (an Italian utility company) along with forming new relationship with People's Choice Credit Union (one of the largest credit unions in Australia). Notably, CRM’s relationship with the U.S. Federal Government has deepened as the company recently, was selected by the Department of Education to modernize and streamline the experience related to a federal student loan.
Business Combinations during FY19: CRM acquired Datorama, Inc. (provides a platform for enterprises, agencies & publishers to integrate data across marketing channels and data sources) in August 2018 for the consideration of ~$766 million. The financial results of Datorama were consolidated with CRM with no material effect on financial statements. The period saw important development with the acquisition of MuleSoft (a platform provider for building application networks which connects enterprise apps, data and devices, across any cloud and on-premise solution) for a transaction value of $6.4 billion in May 2018. CloudCraze LLC (a commerce platform that allows businesses to generate online revenue and scale for growth) was also acquired in April 2018 and deal was closed for $190 million. The aforesaid synergistic acquisitions will enable the company to increase its product and services offerings, presence and reach in various market segments of the enterprise cloud computing market.
Business growth strategy: The company focuses on deepening the relationship while cross-selling and upselling. Salesforce intends to expand all editions of service portfolio with new features, functions and increased security through development, acquisitions and partnerships. Along with this, CRM strives to lower the attrition rate of customers and secure the continuity of existing clients.
Increasing share across CRM and Platform: Salesforce.com Inc has been proved to be a value-driven company with rising market share across customer relationship management and various platform. The company has gained market share for its core markets and is no. 1 CRM in terms of sales in 2018.
.png)
Core Markets for CRM (Source: Company Reports)
Top 10 Shareholders: The top 10 shareholders have been highlighted in the table, which together form around 42.38% of the total shareholding. The Fidelity Management & Research Company, and The Vanguard Group, Inc. hold the maximum interest in the company at 11.35% and 7.35%, respectively.
.png)
Top 10 Shareholders (Source: Thomson Reuters)
Latest Development: Alibaba (leading e-commerce and cloud platform player in China) has agreed upon to sell Salesforce’s CRM services in China. The development is expected to positively impact the revenue from APAC, which currently accounts for only 10% of the total revenue.
Guidance & Outlook: For the second quarter of FY20, the company expects revenue to be in the range of $3.94 billion to $3.95 billion with expected yoy growth of 20%. GAAP (loss) EPS is projected at -$0.08 to -$0.07, whereas Non-GAAP EPS is likely to be in the range of $0.46 - $0.47. Current Remaining Performance Obligation Growth for 2Q is expected to be in the range of 20% to 21% (yoy).
Coming to the FY20 guidance, top-line growth is targeted at 21% to 22% to $16.10 billion - $16.25 billion. GAAP EPS and Non-GAAP EPS are projected to come at $0.78 - $0.80 and $2.88 - $2.90, respectively. YOY growth in operating cash flow is expected to be in the range of 20% - 21%.
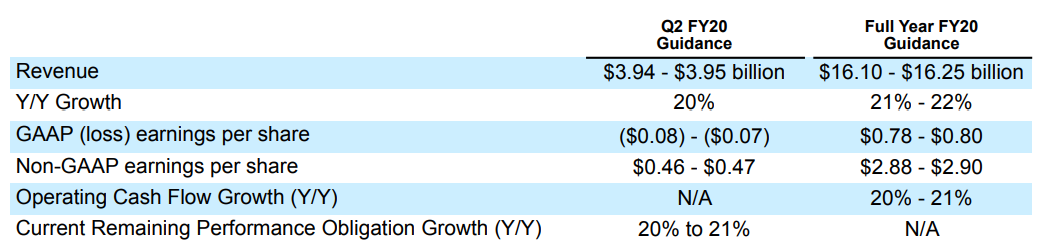
Earnings Forecasts for 2QFY20 & FY20 (Source: Company Reports)
(6).png)
Key Valuation Metrics (Source: Thomson Reuters)
Valuation Methodology:
Method 1: PE Based Valuation (NTM):
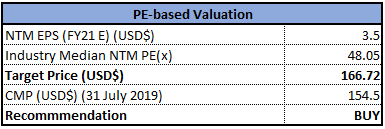
PE-Based Valuation (Source: Thomson Reuters), *NTM-Next Twelve Months
Method 2: EV/Sales Based Valuation (NTM):

EV/Sales Based Valuation (Source: Thomson Reuters), *NTM-Next Twelve Months
Method 3: EV/EBITDA Based Valuation (NTM):
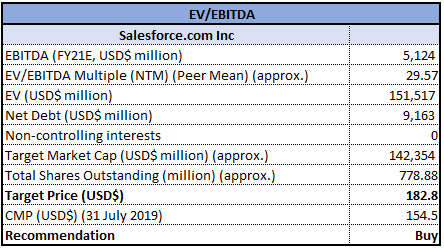
EV/EBITDA Based Valuation (Source: Thomson Reuters), *NTM-Next Twelve Months
Note: All forecasted figures and peers have been taken from Thomson Reuters, *NTM-Next Twelve Months
Stock Recommendation: At the current market price of $154.5, the stock has support at $142.5 level and resistance at around $161 level. Salesforce is the no.1 CRM software provider based on total software revenue worldwide in 2018. The company has delivered consistent durable revenue growth, more than doubling from $5.4 billion in FY15 to $13.3 billion in FY19 and is driving towards a long-term revenue goal of $26 billion to $28 billion in FY23. The company achieved record financial results for 1QFY20 and has strengthened relationship with giants like Google and AWS. Further, acquisitions for organic growth, strong cash availability and balance sheet add to the overall value-driven investment theme. The latest quarterly performance was also highlighted by higher Current Remaining Performance Obligation and strong operating cash flow. With a total addressable market of $142 billion, Salesforce holds a strong market share for Sales, Services, Marketing, Commerce, and Platform and others. Based on the foregoing, we have valued the stock using three relative valuation methods, Price to Earnings multiple, EV to Sales multiple and EV/EBITDA multiple, and have arrived at the target price in the ambit of $166.72 to $182.8 (lower double-digit growth (in %)). Hence, we recommend a “Buy” rating on the stock at the current market price of $154.5 per share, down 1.57% on 31 July 2019.

CRM Daily Technical Chart (Source: Thomson Reuters)
Disclaimer
The advice given by Kalkine Pty Ltd and provided on this website is general information only and it does not take into account your investment objectives, financial situation or needs. You should therefore consider whether the advice is appropriate to your investment objectives, financial situation and needs before acting upon it. You should seek advice from a financial adviser, stockbroker or other professional (including taxation and legal advice) as necessary before acting on any advice. Not all investments are appropriate for all people. Kalkine.com.au and associated websites are published by Kalkine Pty Ltd ABN 34 154 808 312 (Australian Financial Services License Number 425376). The information on this website has been prepared from a wide variety of sources, which Kalkine Pty Ltd, to the best of its knowledge and belief, considers accurate. You should make your own enquiries about any investments and we strongly suggest you seek advice before acting upon any recommendation. Kalkine Pty Ltd has made every effort to ensure the reliability of information contained in its newsletters and websites. All information represents our views at the date of publication and may change without notice. To the extent permitted by law, Kalkine Pty Ltd excludes all liability for any loss or damage arising from the use of this website and any information published (including any indirect or consequential loss, any data loss or data corruption). If the law prohibits this exclusion, Kalkine Pty Ltd hereby limits its liability, to the extent permitted by law to the resupply of services. There may be a product disclosure statement or other offer document for the securities and financial products we write about in Kalkine Reports. You should obtain a copy of the product disclosure statement or offer document before making any decision about whether to acquire the security or product. The link to our Terms & Conditions has been provided please go through them and also have a read of the Financial Services Guide. On the date of publishing this report (mentioned on the website), employees and/or associates of Kalkine Pty Ltd do not hold positions in any of the stocks covered on the website. These stocks can change any time and readers of the reports should not consider these stocks as advice or recommendations.
 CA
CA  AU
AU UK
UK US
US NZ
NZ Please wait processing your request...