RY 144.17 0.4529% TD 77.39 0.0517% SHOP 78.87 -1.3878% CNR 171.64 0.5625% ENB 50.09 -0.4769% CP 110.62 0.6277% BMO 128.85 -0.548% TRI 233.58 1.1563% CNQ 103.29 -0.174% BN 60.87 -0.2295% ATD 75.6 -1.447% CSU 3697.0 1.1582% BNS 65.76 -0.3485% CM 66.6 -0.5525% SU 54.21 1.1569% TRP 53.15 0.3398% NGT 58.54 -0.3405% WCN 226.5 0.4123% MFC 35.905 0.9986% BCE 46.75 -0.5954%

Company Overview: Tiffany & Co. is a holding company that operates through its subsidiary companies. The Company's principal subsidiary, Tiffany and Company (Tiffany), is a jeweler and specialty retailer. The Company's segments include Americas, Asia-Pacific, Japan, Europe and Other. Through its subsidiaries, the Company designs and manufactures products and operates TIFFANY & CO. retail stores around the world, and also sells its products through Internet, catalog, business-to-business and wholesale operations. The Company also sells timepieces, leather goods, sterling silverware, china, crystal, stationery, fragrances and accessories. The Americas segment includes sale in Company-operated TIFFANY & CO. stores in the United States, Canada and Latin America. As of January 31, 2017, the Asia-Pacific segment included 85 Company-operated TIFFANY & CO. stores. As of January 31, 2017, the Japan segment included 55 Company-operated TIFFANY & CO. stores. The Other segment consists of non-reportable segments.
.png)
TIF Details
Tiffany & Co. seems to be progressing well on its transformation path with support coming in from new management team and a good start to 2018. The group now aims to invest in its operations and technology, product offerings, and marketing, digital and visual merchandising to perform well in long-term.
Strong holiday season performance: Tiffany & Co. (NYSE:TIF) delivered a worldwide net sales rise of 8% to $1.05 billion in the two months holiday season ended on December 31, 2017 driven by better performance across their regions and product categories. The comparable store sales enhanced by 5%. Sales performance across categories was seen in the High, Fine and Solitaire and the Fashion jewelry categories during the holiday season while Engagement Jewelry and Wedding Bands category delivered a fractional growth. Total sales in Americas surged by 7% year on year (yoy) to $516 million during the two-month holiday season while the comparable store sales surged 6% driven by higher spending by customers. This performance is a major boost for Tiffany, as their Americas region rose only 1% yoy during the third quarter of 2017. The overall sales softness to lower spending by foreign tourists impacted the performance a bit. On the other hand, the other total sales fell 10% to $18 million during the holiday season but rose 14% in comparable store sales though offset by a fall in wholesale sales of diamonds.
.png)
Sales Summary (Source: Company Reports)
Improving comparable sales growth in Asia-Pacific region: The total sales surged 16% to $232 million during the holiday season on the back of a 7% rise in comparable store sales, new store openings and an increase in wholesale sales. Higher spending from mainland China, Hong Kong and Korea drove the performance. On a constant-exchange-rate basis, the overall sales and comparable store sales surged 13% and 4%, respectively for the holiday period. During the third quarter of 2017, the Asia-Pacific region’s overall sales rose 15% to $283 million in APAC region. The comparable store sales surged 2% but declined 2% in those respective periods due to lower Chinese tourist spending. Thus, the region saw better comparable store sales during the holiday season against the third quarter performance. On the other side, for Japan, the total sales rose 1% to $145 million and comparable store sales were unchanged during the holiday-season. The region witnessed a solid growth in spending attributed to local customers in last year's holiday period. But the holiday season performance was better than the third quarter of 2017 performance, wherein the region’s overall sales reached $139 million during the third quarter and $407 million in the year-to-date which is 8% and 3% below the prior corresponding periods. The comparable store sales for the region fell 8% during the third quarter of 2017 and by 2% in the year-to-date till third quarter. Weaker yen versus dollar also affected the performance.
Europe performance was also decent for the holiday season: During the holiday season, the Europe sales surged 14% to $136 million, driven by opening of new stores (even though management believes that some of them had negative effects on the current store sales in the markets), while comparable store sales rose 2%. Management noted varying performance across the region with overall sales growth attributed to higher local customer spending. The total sales enhanced 5% while comparable store sales fell 7% on a constant-exchange-rate basis. The Europe performance for the holiday season is also impressive as compared to their third quarter of 2017 performance, wherein the total sales rose 5% to $110 million and rose 2% in the year-to-date as of third quarter to $318 million. The comparable store sales fell 3% in both periods. Management noted for the overall retail sales growth across most of continental Europe, and a fall in sales in the U.K. (which had achieved strong growth in last year's third quarter post the weakening of the British pound). The total sales increased 1% in the quarter on a constant-exchange-rate basis, and 3% in the year-to-date due to the effect of new stores. But comparable store sales declined 8% and 2%, respectively during the quarter.
.png)
Earnings Scenario (Source: Company Reports)
Improving margins: For the third quarter of 2017, Tiffany Gross margin improved to 61.3% against 61.0% in the prior corresponding year. As a result, the year-to-date performance ended on third quarter reflected gross margin increase to 61.9% versus 61.4% in the prior year, driven by favorable product input costs. On the other side, the group reported 1% yoy rise in net inventories to $2.3 billion as at October 31, 2017. They have cash of $1.0 billion as at October 31, 2017, against $787 million in prior corresponding period (pcp). The group spent $60 million, for buying over 653,000 shares as of year to date ending third quarter of 2017. They have $250 million available for repurchases under the program as of October 31st, 2017 that authorizes the repurchase of up to $500 million of the Common Stock and that expires on January 31, 2019.
Upgraded 2017 Outlook: Given the solid holiday period performance, the group upgraded their worldwide net sales forecast for fiscal 2017 to rise by over 4% as reported and on a constant-exchange-rate basis against prior corresponding period as compared to their earlier low-single-digit percentage increase. The net earnings per diluted share is expected to rise by a double-digit percentage over 2016's net earnings per diluted share of $3.55 and by at least a high-single-digit percentage against FY16. These expectations do not include the effect of the recent revisions to the U.S. tax code, including certain charges that management expects to record in the fourth quarter ending January 31, 2018. Management forecasts that such re-measurement and such deemed repatriation tax would lead to aggregate charges of $115-$165 million in the quarter ending January 31, 2018. Moreover, some of the assumptions for the forecasts include the worldwide gross retail square footage rising by 2%, net through nine store openings, seven relocations and seven closings. Operating margin is expected to be above the prior year while interest and other expenses, are expected to be net of $35-$37 million. For 2017, the net cash provided by operating activities is expected to be at least $735 million while free cash flow would be more than $500 million. The group expects to incur capital expenditures of $235 million. Meanwhile, for 2018 the group expects a mid-single-digit percentage rise in worldwide sales. Rising levels of spending in a number of areas, including technology, marketing communications, visual merchandising, digital, and store presentations, would drive their required longer-term sales, margin and earnings growth objectives. The net earnings per diluted share is expected to be flat to slightly down from the forecasted 2017 net earnings per diluted share without any tax impact. But net earnings per diluted share in fiscal 2018 is expected to benefit, from a potential lower effective income tax rate leading from the recent revisions to the U.S. tax code.
Stock performance: Tiffany expanded to 316 stores (125 in the Americas, 87 in Asia-Pacific, 54 in Japan, 46 in Europe, and four in the UAE) as of December 2017, as compared to 314 stores in the prior corresponding period (with 125 in the Americas, 86 in Asia-Pacific, 55 in Japan, 43 in Europe, and five in the UAE). Despite the positive holiday sales results, the group sees that the preceding negative comparable store sales trend can only be reversed on a sustainable basis by continuing to evolve their product offerings and customer experience and also by stepping up certain strategic spending in their business. The recent holiday period performance shows that the brand continued to be strong, while the group intends to leverage this brand value for numerous long-term global opportunities. The shares of Tiffany rose over 4% in this year to date with a total rise of over 35.5% in the last one year (as at January 31, 2018) while we believe the bullish momentum will continue. Based on the foregoing, we give a “Buy” recommendation on the stock at the current price of $106.65
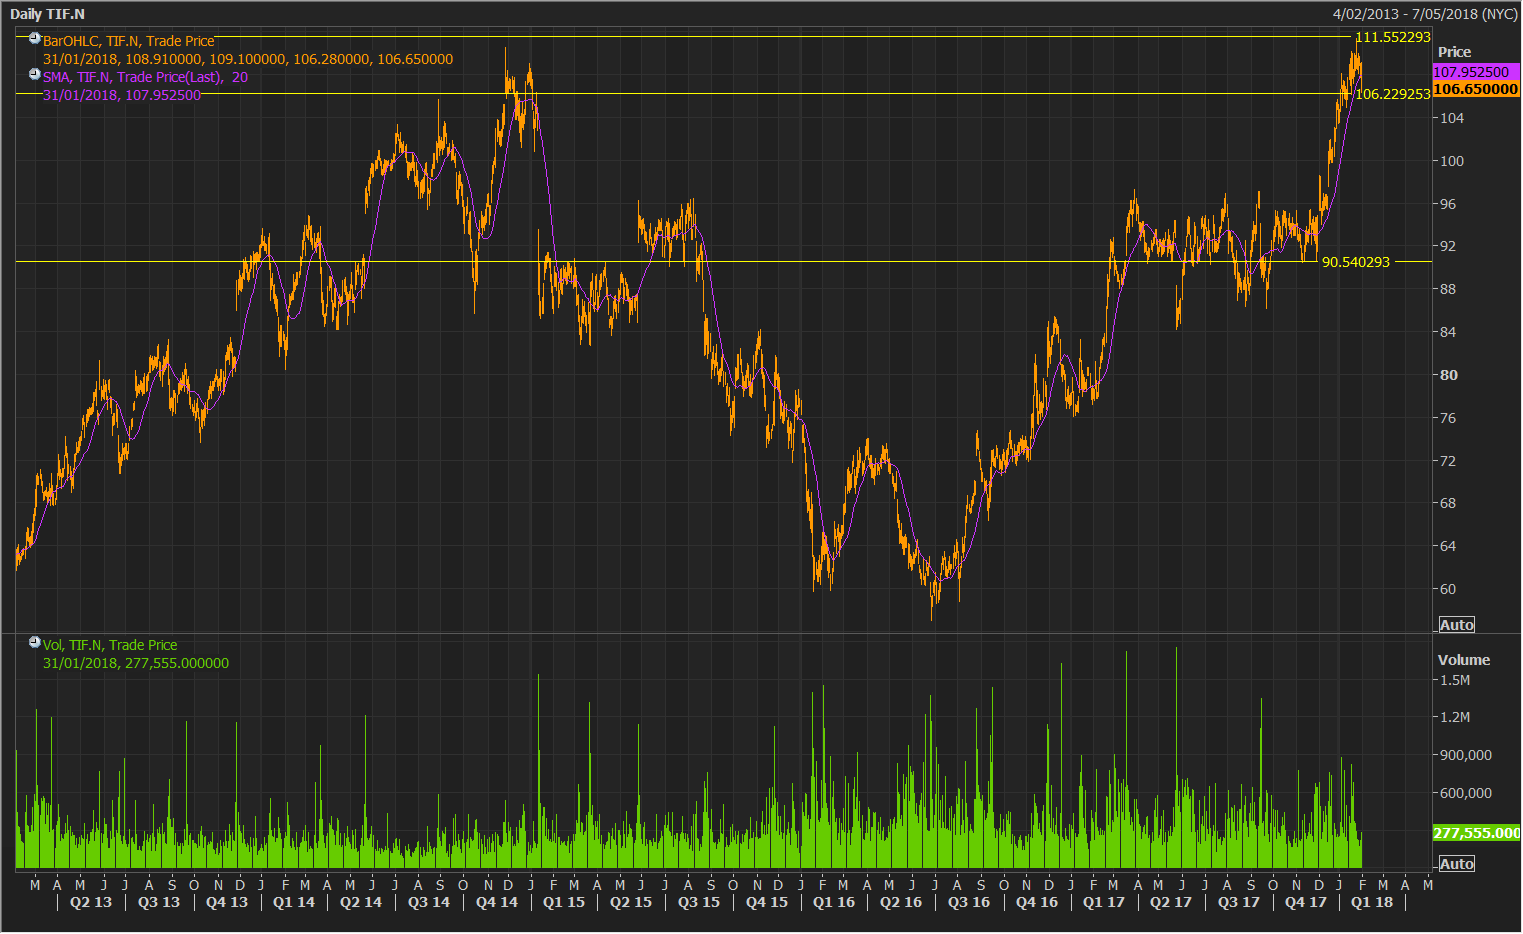
TIF Daily Chart (Source: Thomson Reuters)
Disclaimer
is general information only and it does not take into account your investment objectives, financial situation or needs. You should therefore consider whether the advice is appropriate to your investment objectives, financial situation and needs before acting upon it. You should seek advice from a financial adviser, stockbroker or other professional (including taxation and legal advice) as necessary before acting on any advice. Not all investments are appropriate for all people. Kalkine.com.au and associated websites are published by Kalkine Pty Ltd ABN 34 154 808 312 (Australian Financial Services License Number 425376). The information on this website has been prepared from a wide variety of sources, which Kalkine Pty Ltd, to the best of its knowledge and belief, considers accurate. You should make your own enquiries about any investments and we strongly suggest you seek advice before acting upon any recommendation. Kalkine Pty Ltd has made every effort to ensure the reliability of information contained in its newsletters and websites. All information represents our views at the date of publication and may change without notice. To the extent permitted by law, Kalkine Pty Ltd excludes all liability for any loss or damage arising from the use of this website and any information published (including any indirect or consequential loss, any data loss or data corruption). If the law prohibits this exclusion, Kalkine Pty Ltd hereby limits its liability, to the extent permitted by law to the resupply of services. There may be a product disclosure statement or other offer document for the securities and financial products we write about in Kalkine Reports. You should obtain a copy of the product disclosure statement or offer document before making any decision about whether to acquire the security or product. The link to our Terms & Conditions has been provided please go through them and also have a read of the Financial Services Guide. On the date of publishing this report (mentioned on the website), employees and/or associates of Kalkine Pty Ltd do not hold positions in any of the stocks covered on the website. These stocks can change any time and readers of the reports should not consider these stocks as advice or recommendations.
 CA
CA  AU
AU UK
UK US
US NZ
NZ Please wait processing your request...